

Answered step by step
Verified Expert Solution
Question
1 Approved Answer
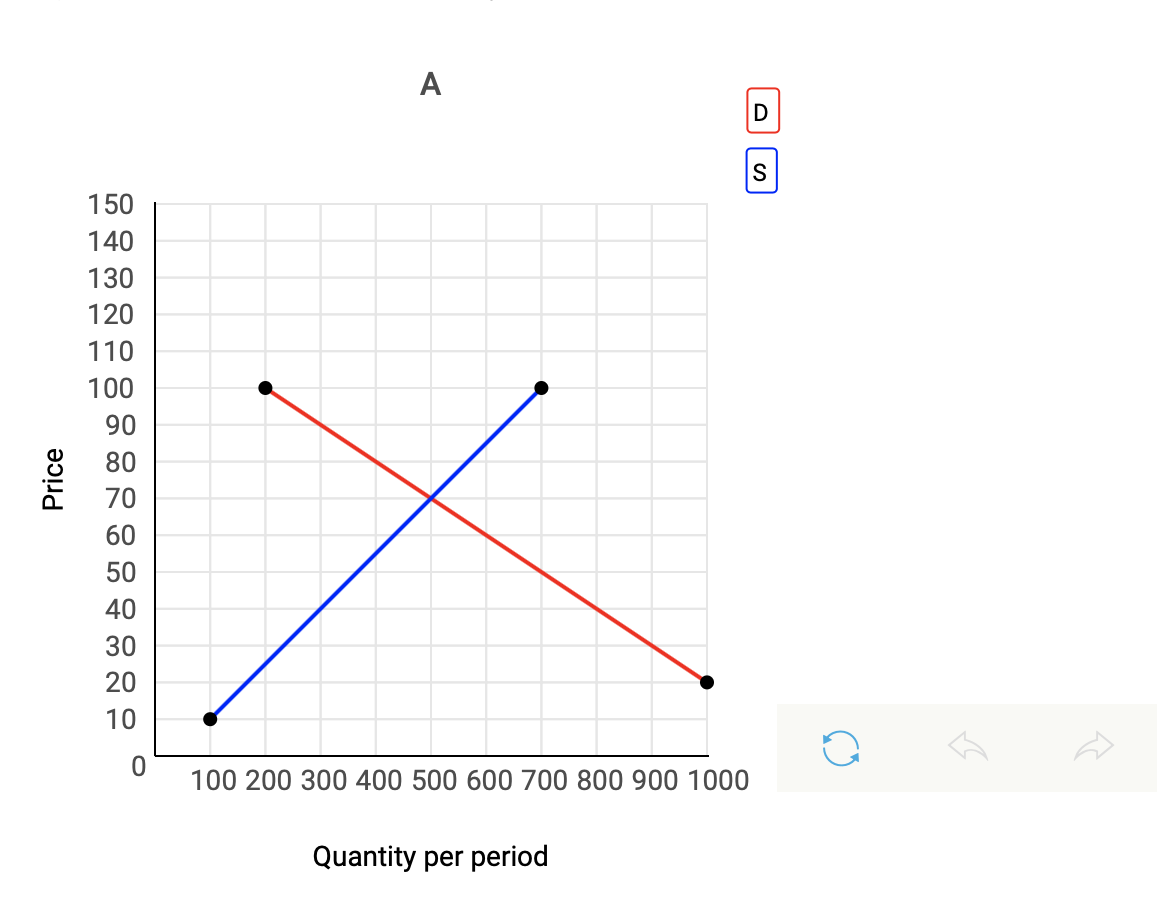
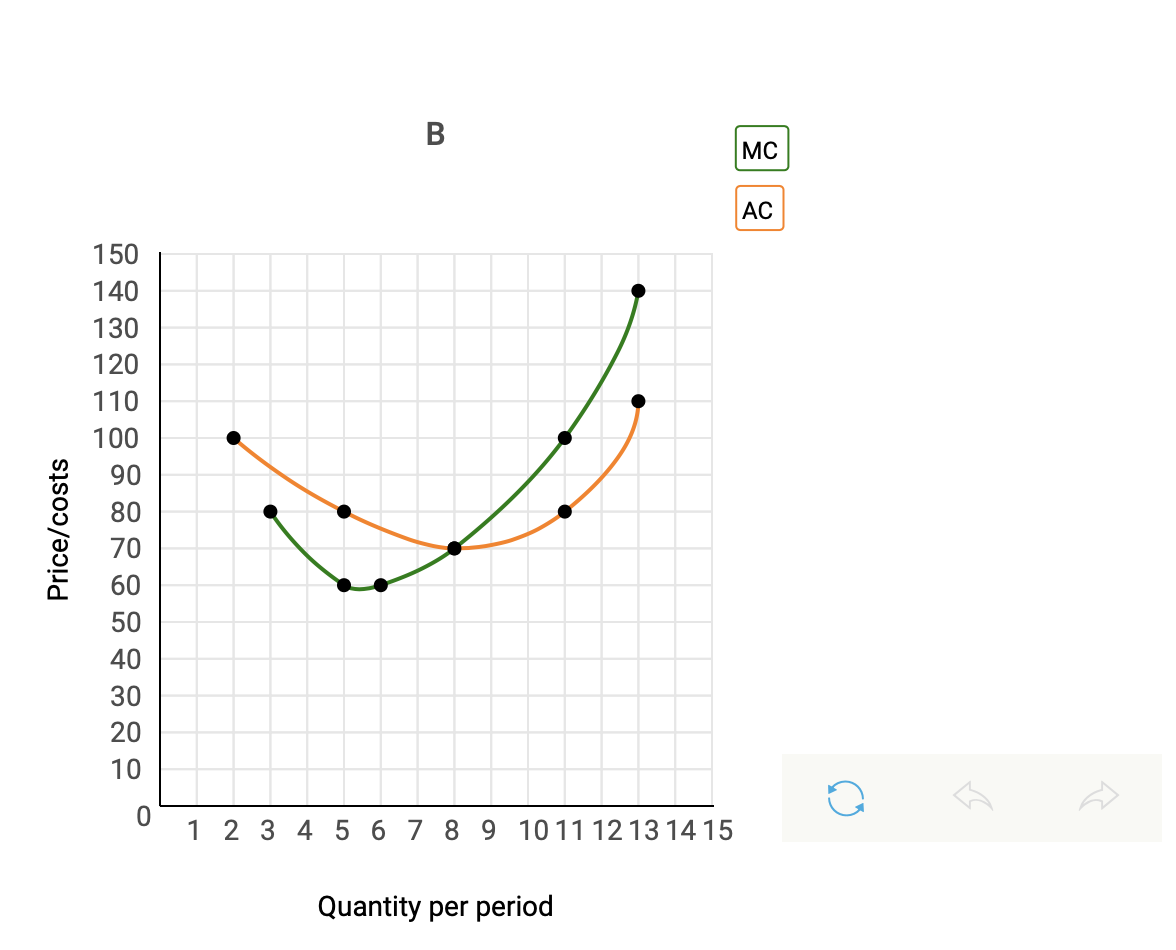
In graph A belowshows the market demand and supply in a competitive market, and graph B shows the cost curves of a representative firm in
In graph A belowshows themarketdemand and supply in a competitive market, and graph B shows the cost curves of a representativefirmin that industry.
Step by Step Solution
There are 3 Steps involved in it
Step: 1

Get Instant Access to Expert-Tailored Solutions
See step-by-step solutions with expert insights and AI powered tools for academic success
Step: 2

Step: 3
Ace Your Homework with AI
Get the answers you need in no time with our AI-driven, step-by-step assistance
Get Started
Strategic Management And Business Policy Toward Global Sustainability
Authors: Thomas L. Wheelen, J. David Hunger
13th Edition
9780132998079, 132998076, 978-0132153225