Answered step by step
Verified Expert Solution
Question
1 Approved Answer
In HBR Tokyo DisneySea case, how do you calculate the NVP and IRR? To the comment below, yes it is referring to that case. Cost


 In HBR Tokyo DisneySea case, how do you calculate the NVP and IRR?
To the comment below, yes it is referring to that case.
Cost of debt is 4.34% from 1998-2004
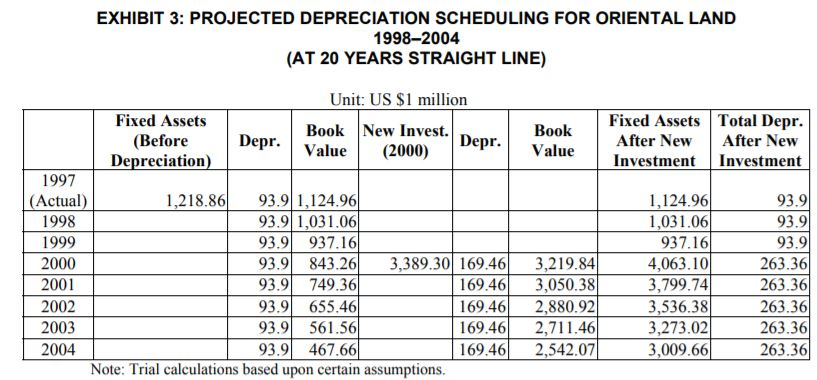
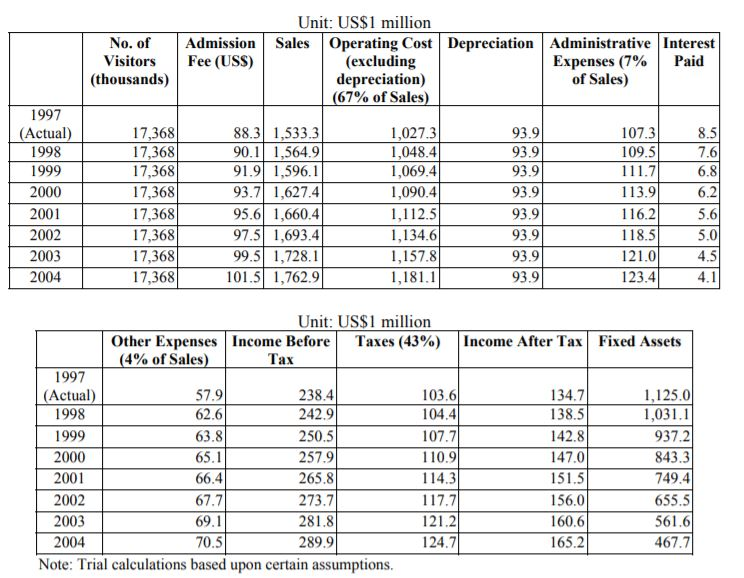
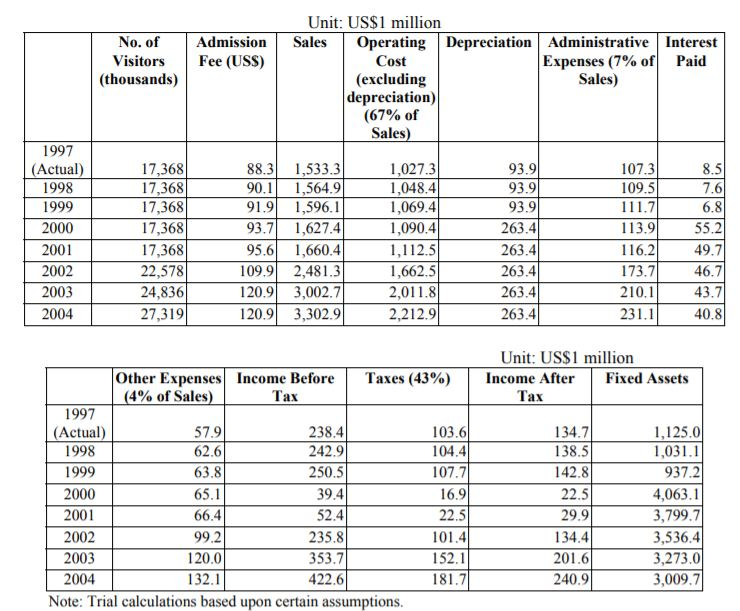
EXHIBIT 3: PROJECTED DEPRECIATION SCHEDULING FOR ORIENTAL LAND 1998-2004 (AT 20 YEARS STRAIGHT LINE) Book Value Fixed Assets After New Investment Total Depr. After New Investment Unit: US $1 million Fixed Assets Book New Invest. (Before Depr. Value (2000) Depreciation) 1997 (Actual) 1,218.86 93.9 1,124.96 1998 93.9 1,031.06 1999 93.9 937.16 2000 93.9 843.26 3,389.30 169.46 2001 93.9 749.36 169.46 2002 93.91 655.46 169.46 2003 93.9 561.56 169.46 2004 93.9 467.66 169.46 Note: Trial calculations based upon certain assumptions. 3,219.84 3,050.38 2.880.92 2,711.46 2,542.07 1,124.96 1,031.06 937.16 4,063.10 3,799.74 3,536.38 3,273.02 3,009.66 93.91 93.9 93.9 263.36 263.36 263.36 263.36 263.36 No. of Visitors (thousands) Admission Fee (USS) Unit: US$1 million Sales Operating Cost Depreciation Administrative Interest (excluding Expenses (7% Paid depreciation) of Sales) (67% of Sales) 93.9 1997 (Actual) 1998 1999 2000 2001 2002 2003 2004 17,368 17,368 17,368 17,368 17,368 17,368 17,368 17,368 88.3 1,533.3 90.1 1,564.9 91.9 1,596.1 93.7| 1,627.4 95.6 1,660.4 97.5) 1,693.4 99.5 1,728.1 101.5 1,762.91 1,027.3 1,048.4 1,069.4 1,090.4 1,112.5 1,134.6 1,157.8 1,181.11 93.9 93.9 93.9 93.91 93.9 93.9 93.91 107.3 109.5 111.7 113.9 116.2 118.5 121.01 123.4 5.6 5.0 4.5 4.1 Unit: US$1 million Other Expenses Income Before Taxes (43%) Income After Tax Fixed Assets (4% of Sales) Tax 1997 (Actual) 57.9 238.4 103.6 134.7 1,125.0 1998 62.6 242.91 104.4 138.5| 1,031.1 1999 63.81 250.51 107.7 142.81 937.2 2000 65.1 257.91 110.9 147.01 843.3 2001 66.4 265.81 114.3 151.5 749.4 2002 67.7 273.7 117.7 156.0 655.5 2003 69.1 281.8 121.21 160.6 561.6 2004 124.7 165.2 467.7 Note: Trial calculations based upon certain assumptions. 70.51 289.9 No. of Admission Fee (USS) Unit: US$1 million Sales Operating Depreciation Cost (excluding depreciation) (67% of Sales) Administrative Interest Expenses (7% of Paid Sales) (thousands) 93.91 1997 (Actual) 1998 1999 2000 2001 2002 2003 2004 17,368 17,368 17,368 17,368 17,368 22,578 24,8361 27,319 88.3 90.1 91.9 93.7 95.6 109.9 120.9 120.9 1,533.3 1,564.9 1,596.1 1,627.4 1,660.4 2,481.3 3,002.7 3,302.9 1,027.3 1,048.4 1,069.4 1,090.4 1,112.5 1,662.51 2,011.8 2,212.9 93.9 93.9 263.4 263.4 263.4 263.4 263.4 107.3 109.5 111.71 113.91 116.2 173.7 210.11 231.1 Unit: US$1 million Income After Fixed Assets Tax Other Expenses Income Before Taxes (43%) (4% of Sales) 1997 (Actual) 238.4 103.6 1998 242.9 104.4 1999 63.81 250.5 107.7 2000 65.1 39.4 16.9 2001 66.4 52.41 22.5 2002 99.2 235.81 101.4 2003 120.0 353.7 2004 132.1 422.61 181.71 Note: Trial calculations based upon certain assumptions. 134.7) 138.5 142.8 22.5 29.91 134.4 201.6 240.91 1,125.0 1,031.1 937.2 4,063.1 3,799.7 3,536.4 3,273.0 3,009.71 152.11 Depreciation The New Project Income Cash Flow Fixed Assets Unit: US$1 million Without the Project With the Project Depreciation Cash Depreciation Income Cash Flow Flow 1997 (Actual) 93.9 134.7 228.6 93.9 134.7 228.6 1998 93.9 138.7 222.6 93.9 138.5 215.1 1999 93.9 142.8 226.7 93.9 142.8 219.0 2000 93.9 147.0 230.6 263.3 22.5 284.2 2001 93.9 151.5 234.8 263.3 29.9 291.2 2002 93.9 156.0 239.1 263.3 134.4 388.3 2003 93.9 160.6 243.2 263.3 201.6 450.8 2004 93.9 165.6 247.5 263.3 240.9 487.7 Note: Trial calculations based upon certain assumptions. 0 0 0 169.4 169.4 169.4 | 169.4 169.4 (124.5) (121.6) (21.6) 41.0 75.3 44.9 47.8 147.8 210.4 244.7 3.219.8 3,050.3 2,880.9 2,711.4 2,541.9 EXHIBIT 3: PROJECTED DEPRECIATION SCHEDULING FOR ORIENTAL LAND 1998-2004 (AT 20 YEARS STRAIGHT LINE) Book Value Fixed Assets After New Investment Total Depr. After New Investment Unit: US $1 million Fixed Assets Book New Invest. (Before Depr. Value (2000) Depreciation) 1997 (Actual) 1,218.86 93.9 1,124.96 1998 93.9 1,031.06 1999 93.9 937.16 2000 93.9 843.26 3,389.30 169.46 2001 93.9 749.36 169.46 2002 93.91 655.46 169.46 2003 93.9 561.56 169.46 2004 93.9 467.66 169.46 Note: Trial calculations based upon certain assumptions. 3,219.84 3,050.38 2.880.92 2,711.46 2,542.07 1,124.96 1,031.06 937.16 4,063.10 3,799.74 3,536.38 3,273.02 3,009.66 93.91 93.9 93.9 263.36 263.36 263.36 263.36 263.36 No. of Visitors (thousands) Admission Fee (USS) Unit: US$1 million Sales Operating Cost Depreciation Administrative Interest (excluding Expenses (7% Paid depreciation) of Sales) (67% of Sales) 93.9 1997 (Actual) 1998 1999 2000 2001 2002 2003 2004 17,368 17,368 17,368 17,368 17,368 17,368 17,368 17,368 88.3 1,533.3 90.1 1,564.9 91.9 1,596.1 93.7| 1,627.4 95.6 1,660.4 97.5) 1,693.4 99.5 1,728.1 101.5 1,762.91 1,027.3 1,048.4 1,069.4 1,090.4 1,112.5 1,134.6 1,157.8 1,181.11 93.9 93.9 93.9 93.91 93.9 93.9 93.91 107.3 109.5 111.7 113.9 116.2 118.5 121.01 123.4 5.6 5.0 4.5 4.1 Unit: US$1 million Other Expenses Income Before Taxes (43%) Income After Tax Fixed Assets (4% of Sales) Tax 1997 (Actual) 57.9 238.4 103.6 134.7 1,125.0 1998 62.6 242.91 104.4 138.5| 1,031.1 1999 63.81 250.51 107.7 142.81 937.2 2000 65.1 257.91 110.9 147.01 843.3 2001 66.4 265.81 114.3 151.5 749.4 2002 67.7 273.7 117.7 156.0 655.5 2003 69.1 281.8 121.21 160.6 561.6 2004 124.7 165.2 467.7 Note: Trial calculations based upon certain assumptions. 70.51 289.9 No. of Admission Fee (USS) Unit: US$1 million Sales Operating Depreciation Cost (excluding depreciation) (67% of Sales) Administrative Interest Expenses (7% of Paid Sales) (thousands) 93.91 1997 (Actual) 1998 1999 2000 2001 2002 2003 2004 17,368 17,368 17,368 17,368 17,368 22,578 24,8361 27,319 88.3 90.1 91.9 93.7 95.6 109.9 120.9 120.9 1,533.3 1,564.9 1,596.1 1,627.4 1,660.4 2,481.3 3,002.7 3,302.9 1,027.3 1,048.4 1,069.4 1,090.4 1,112.5 1,662.51 2,011.8 2,212.9 93.9 93.9 263.4 263.4 263.4 263.4 263.4 107.3 109.5 111.71 113.91 116.2 173.7 210.11 231.1 Unit: US$1 million Income After Fixed Assets Tax Other Expenses Income Before Taxes (43%) (4% of Sales) 1997 (Actual) 238.4 103.6 1998 242.9 104.4 1999 63.81 250.5 107.7 2000 65.1 39.4 16.9 2001 66.4 52.41 22.5 2002 99.2 235.81 101.4 2003 120.0 353.7 2004 132.1 422.61 181.71 Note: Trial calculations based upon certain assumptions. 134.7) 138.5 142.8 22.5 29.91 134.4 201.6 240.91 1,125.0 1,031.1 937.2 4,063.1 3,799.7 3,536.4 3,273.0 3,009.71 152.11 Depreciation The New Project Income Cash Flow Fixed Assets Unit: US$1 million Without the Project With the Project Depreciation Cash Depreciation Income Cash Flow Flow 1997 (Actual) 93.9 134.7 228.6 93.9 134.7 228.6 1998 93.9 138.7 222.6 93.9 138.5 215.1 1999 93.9 142.8 226.7 93.9 142.8 219.0 2000 93.9 147.0 230.6 263.3 22.5 284.2 2001 93.9 151.5 234.8 263.3 29.9 291.2 2002 93.9 156.0 239.1 263.3 134.4 388.3 2003 93.9 160.6 243.2 263.3 201.6 450.8 2004 93.9 165.6 247.5 263.3 240.9 487.7 Note: Trial calculations based upon certain assumptions. 0 0 0 169.4 169.4 169.4 | 169.4 169.4 (124.5) (121.6) (21.6) 41.0 75.3 44.9 47.8 147.8 210.4 244.7 3.219.8 3,050.3 2,880.9 2,711.4 2,541.9Step by Step Solution
There are 3 Steps involved in it
Step: 1

Get Instant Access to Expert-Tailored Solutions
See step-by-step solutions with expert insights and AI powered tools for academic success
Step: 2

Step: 3

Ace Your Homework with AI
Get the answers you need in no time with our AI-driven, step-by-step assistance
Get Started


