

Answered step by step
Verified Expert Solution
Question
1 Approved Answer
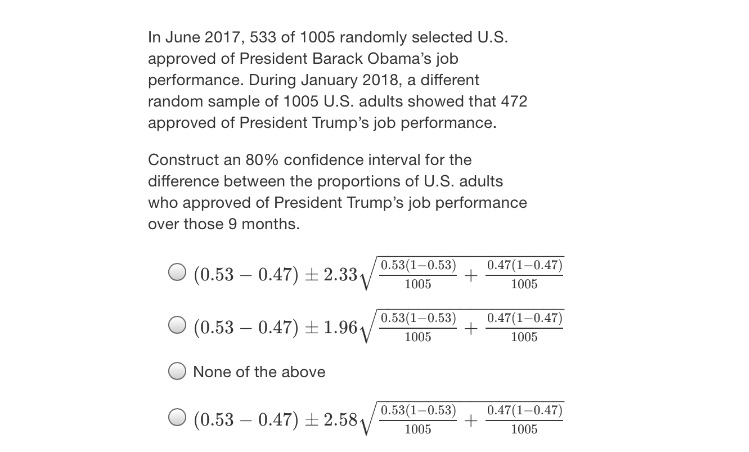
In June 2017, 533 of 1005 randomly selected U.S. approved of President Barack Obama's job performance. During January 2018, a different random sample of 1005
Step by Step Solution
There are 3 Steps involved in it
Step: 1

Get Instant Access to Expert-Tailored Solutions
See step-by-step solutions with expert insights and AI powered tools for academic success
Step: 2

Step: 3
Ace Your Homework with AI
Get the answers you need in no time with our AI-driven, step-by-step assistance
Get Started
Calculus An Applied Approach
Authors: Ron Larson, Dennis J McKenzie, Larson/Edwards, Bruce H Edwards
7th Edition
1111809720, 9781111809720