In Jupyter notebook format
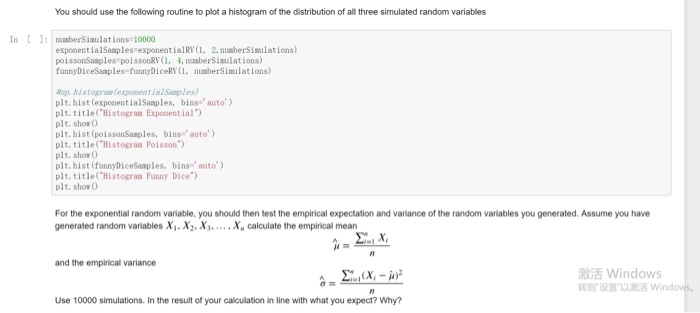
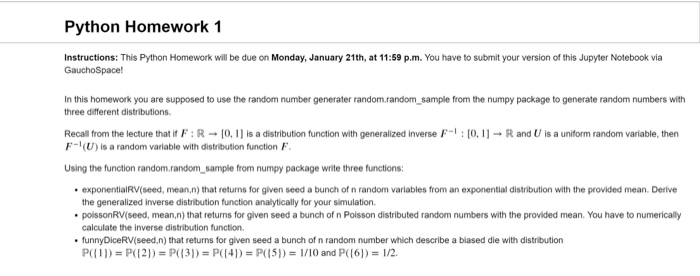
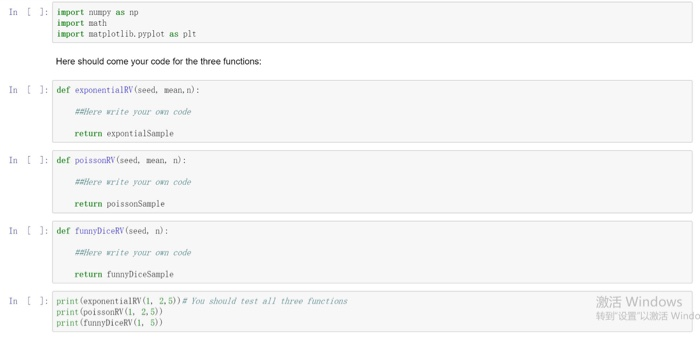
Python Homework 1 Instructions: This Python Homework will be due on Monday, January 21th, at 11:59 p.m. You have to submit your version of this Jupyter Notebook via GauchoSpace In this homework you are supposed to use the random number generater random.random sample from the numpy package to generate random numbers with three different distributions Recall from the lecture that if F:R 0, 1] is a distribution function with generalized inverse F-1 [0, 1 F-(U) is a random variable with distribution function F R and U is a uniform random variable, then Using the function random.random sample from numpy package write three functions: exponentialRV(seed, mean,n) that returns for given seed a bunch of n random variables from an exponential distribution with the provided mean. Derive the generalized inverse distribution function analytically for your simulation. poissonRV(seed, mean,n) that returns for given seed a bunch of n Poisson distributed random numbers with the provided mean. You have to numerically calculate the inverse distribution function. funnyDiceRV(seed,n) that returns for given seed a bunch of n random number which describe a biased die with distribution In 1: isport numpy as np import math import matplotlib. pyplot as plt Here should come your code for the three functions: In : def exponentialRV (seed, nean, n): #aHere write your own code return expontialSample In : def poissonRY (seed, mean, n): ##Here write your own code return poissonSample In J: def funnyDiceRV (seed, n): #aHere write your own code return funnyDiceSample In [ ] : print (exponent ialRV(1, 2, 5))2 ru should test all three functions print (poissonRV (1, 2, 5)) print (funnyDiceRV(1, 5)) Windows "Wind You should use the following routine to plot a histogram of the distribution of all three simulated random variables In :aberSiaulations 10000 exponentialSamples-exponentialRV(1, 2, numberSisulations) poissonSasples poissonRV (1, 4, nmberSiaulations) funnyDiceSaaples-funnyDiceRV (, numberSisulations) #rp. histogram (exponent ialSaaples) plt. hist (exponentialSamples, bins 'auto) plt. title("Histogran Exponent ial) plt. show0 plt. hist (poissonSasples, bins auto plt.title("Histogran Poisson plt. show ( plt. hist (funnyDiceSaaples, bins auto plt. title("Histogran Funny Dice) plt.show For the exponential random variable, you should then test the empirical expectation and variance of the random variables you generated. Assume you have generated random variables XXXX, calculate the empirical mean and the empirical variance Windows ,Wind Use 10000 simulations. In the result of your calculation in line with what you expect? Why


 In Jupyter notebook format


