Answered step by step
Verified Expert Solution
Link Copied!

Question

1 Approved Answer

In Lab 7, we looked at the relationship between how long (in minutes) students spend per day on Facebook and their GPA. We also collected

In Lab 7, we looked at the relationship between how long (in minutes) students spend per day on Facebook and their GPA. We also collected information from the 19 students who took MATH2208 in our sample about how many hours of sleep they get each night and what time they get up in the morning (where 8 a.m. = 800)

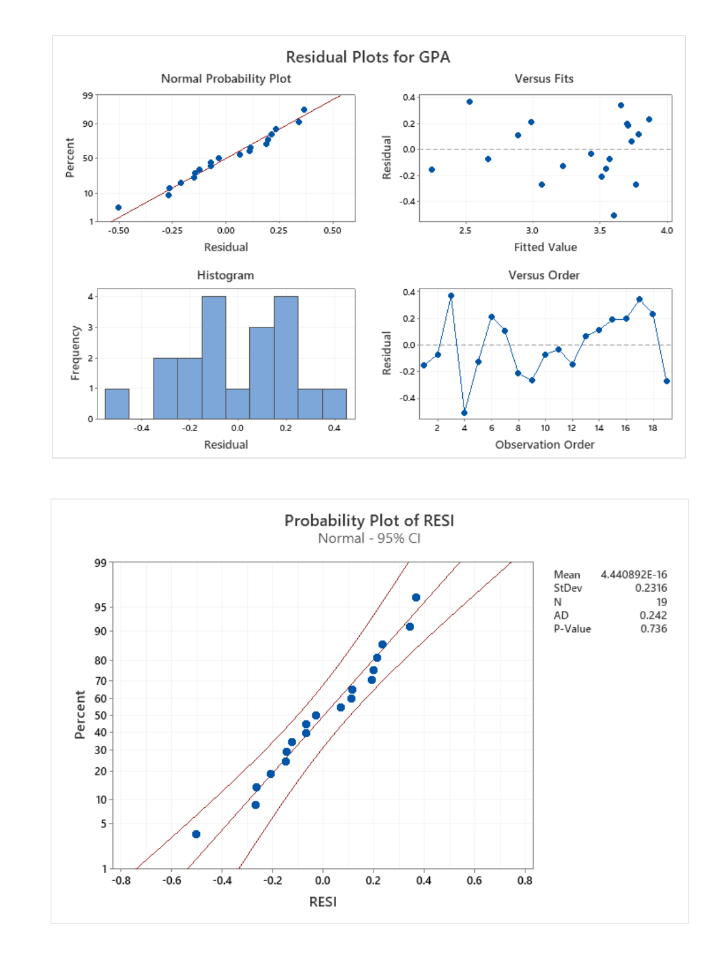
Are the assumptions and conditions for a multiple regression model satisfied?For the independence assumption, explain in context. For the remaining assumptions, clearly refer to the appropriate graph(s)

1) Independence Assumption - Randomization condition:

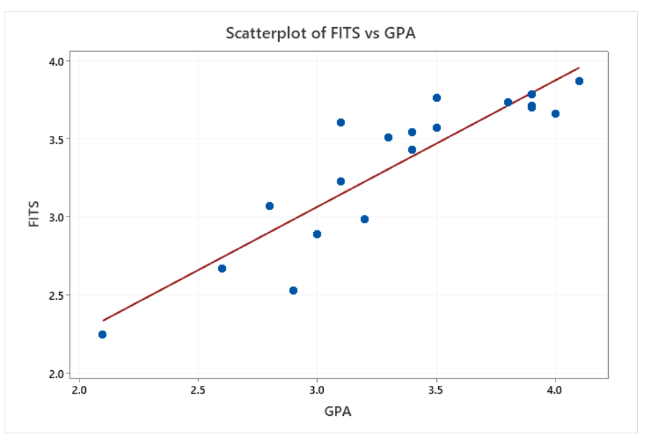
2) Is the linearity assumption met? Check the straight enough condition.

This condition is a)met, since the a)scatterplot shows a general linear pattern and the

b)not met b)fitted line plot

c)normal probability plot

d)vs fit plot

e)histogram

a)scatterplot shows random scatter.

b)fitted line plot

c)normal probability plot

d)vs fit plot

e)histogram

3)Is the Equal Variance assumption: Does the plot thicken? Condition met?

4)Is the normal population assumption met?

Nearly normal condition: This condition is a)met since the histogram is a)approximately symmetric

b)not met b)skewed left

c)skewed right

d)unimodal

e)bimodal

and the normal probability plot is a)curved

b)straight

c)thickening

d)not thickening

e)randomly scattered

Outlier condition: This condition is a)met since although the histogram shows

b)not met

a)no outliers the normal probability plot shows a) a curve

b)a gap b)a general linear pattern

c)outliers c)points outside the bounds

d)no points outside the bounds
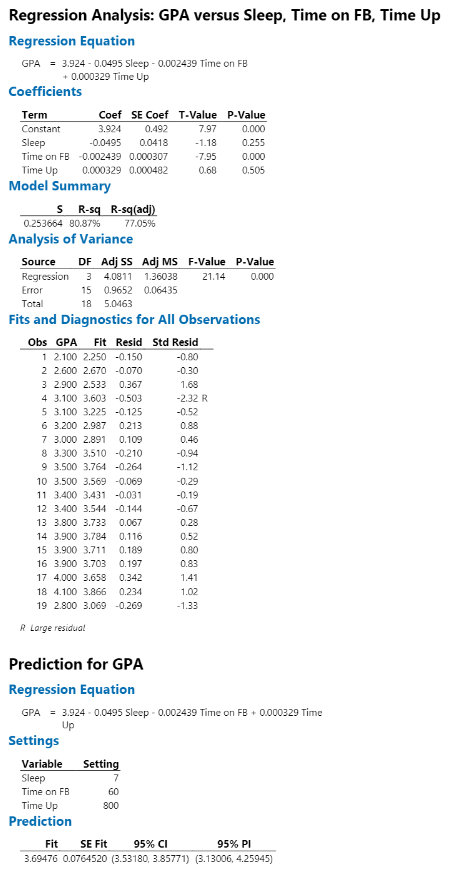
image text in transcribedimage text in transcribedimage text in transcribed
Regression Analysis: GPA versus Sleep, Time on FB, Time Up Regression Equation GPA = 3.924 - 0.0495 Sleep - 0.002439 Time on FB + 0.000329 Time Up Coefficients Term Coef SE Coef T-Value P.Value Constant 3.924 0.492 7.97 0.000 Sleep -0.0495 0.0418 -1.18 0.255 Time on FB -0.002439 0.000307 -7.95 0.000 Time Up 0,000329 0.000482 0.68 0,505 Model Summary 5 R-sq R-sq(adj) 0.253664 80.875 77.05% Analysis of Variance Source DF Adj 55 Adj MS F-Value P-Value Regression 3 4.0811 1.36038 21.14 0.000 Error 15 0.9652 0.06435 Total 18 5.0463 Fits and Diagnostics for All Observations Obs GPA Fit Resid Std Resid 1 2.100 2.250 -0.150 -0.80 2 2.600 2.670 -0.070 -0.30 3 2.900 2.533 0.367 1.68 4 3.100 3.603 -0.503 -2.32 R 5 3.100 3.225 -0.125 -0.52 6 3.200 2.987 0.213 0.88 7 3.000 2.891 0.109 0.46 8 3.300 3.510 -0.210 -0.94 9 3.500 3.764 -0.264 -1.12 10 3.500 3.569 -0.069 -0.29 11 3.400 3.431 -0.031 -0.19 12 3.400 3.544 -0.144 -0.67 13 3.800 3.733 0.067 0.28 14 3.900 3.784 0.116 0.52 15 3.900 3.711 0.189 0.80 16 3.900 3.703 0.197 0.83 17 4.000 3.658 0.342 1.41 18 4.100 3.866 0.234 1.02 19 2.800 3.069 -0.269 -1.33 R Large residual Prediction for GPA Regression Equation GPA = 3.924 - 0.0495 Sleep - 0.002439 Time on FB + 0.000329 Time Up Settings Variable Setting Sleep Time on FB 60 Time Up 800 Prediction Fit SE Fit 95% CI 95% PI 3.69476 0.0764520 (3.53180, 3.85771) (3.13006, 4.25945)Residual Plots for GPA Normal Probability Plot Versus Fits 95 DA 0.2 Residual Percent 50 02 10 0.50 -0.25 0.00 0.25 0.50 2.5 3.0 3.5 10 Residual Fitted Value Histogram Versus Order 0.4 02 w 0.0 Residual Frequency NN -0.2 -04 04 -0.2 0.0 0.2 0.4 6 10 12 14 16 18 Residual Observation Order Probability Plot of RESI Normal - 95% CI 99 Mean 4.440892E-16 StDev 0.2316 N 19 95 AD 0.242 90 P-Value 0.736 Percent 8 8 8688 8 10 un -0.8 -0.6 -0.4 -0.2 0.0 0.2 0.4 0.6 0.8 RESIScatterplot of FITS vs GPA 4.0 3.5 FITS 3.0 2.5 2.0 2.0 2.5 3.0 3.5 4.0 GPA

Step by Step Solution

There are 3 Steps involved in it

Step: 1

blur-text-image

Get Instant Access to Expert-Tailored Solutions

See step-by-step solutions with expert insights and AI powered tools for academic success

Step: 2

blur-text-image_2

Step: 3

blur-text-image_3

Ace Your Homework with AI

Get the answers you need in no time with our AI-driven, step-by-step assistance

Get Started

Recommended Textbook for

Precalculus Enhanced With Graphing Utilities (Subscription)

Authors: Michael, Michael Sullivan III, Michael III Sullivan, III Sullivan

6th Edition

0321849108, 9780321849106

More Books

Students also viewed these Mathematics questions

Question

Solve for x: 2(3x 1)2(x + 5) = 12

Answered: 1 week ago