

Question
In late May 2003 executives in Stryker Corporations Instruments business were actively considering a change in their sourcing strategy for printed circuit boards (PCBs), a
In late May 2003 executives in Stryker Corporations Instruments business were actively
considering a change in their sourcing strategy for printed circuit boards (PCBs), a key electronic
component of many of Stryker Instruments medical products. Currently, Stryker purchased PCBs
from a small number of contract manufacturers. The Instruments business anticipated spending
more than $10 million in each of the next two years on PCBs, an amount that would increase as the
Instruments business grew. In recent years, the performance of some contract manufacturers had
been unsatisfactory with respect to quality, delivery and/or responsiveness and Stryker had
repeatedly found itself looking for new suppliers. More generally, contract manufacturers tended to
operate on thin margins with scant capital. Bankruptcies were not uncommon, and even without
bankruptcy, a financially weak supplier was simply less reliable. Given recent events and the shaky
appearance of several current suppliers, Stryker Instruments had resolved to address the issue.
Stryker Instruments manufacturing managers studied three options for improving the situation.
Option #1 was to maintain the current basic sourcing policy for PCBs, but with important
modifications. Specifically, it would protect against future disruptions by acquiring safety stocks of
key materials and instituting dual sourcing of all electronic assemblies. Option #2 would boost
reliability by establishing a partnership with a single supplier, one of the current group of contract
manufacturers. That company would become Stryker Instruments sole supplier of PCBs and
establish a stand-alone facility for supplying them. The partnership and increased business from
Stryker was expected to strengthen the supplier, further boosting its reliability. Option #3 was for
Stryker Instruments to manufacture its own PCBs in its own facility near company headquarters in
Kalamazoo, Michigan. Once such a facility was up and running, it might be expanded to supply
PCBs to other Stryker businesses as well.
Of the three alternatives, Option #3 promised the highest degree of control over quality and
delivery. From that perspective, it was most the attractive. But it also required the largest capital
outlay and the largest increment to Strykers headcount and payroll. Whether it offered an adequate
return on investment was a question that had to be carefully studied. If Stryker Instruments wanted
to proceed with the investment, it would have to obtain numerous approvals. Stryker Corporations
capital budgeting procedures required specific business and financial analyses of proposed
expenditures. The financial analyses included studies of outlays, costs, profitability, risks, and
shareholder returns. More specifically, estimates of net present value (NPV), internal rate of return
(IRR) and payback period all had to be prepared before a project could receive funding.
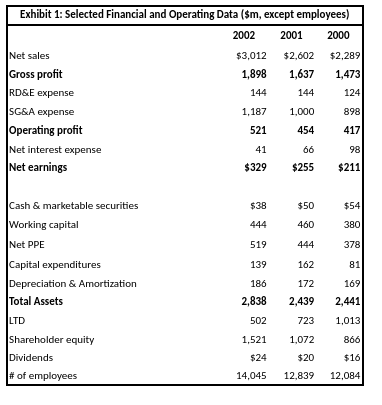
Stryker Corporation was a leading provider of specialty medical and surgical products with 2002
revenues and operating profits of $3.0 billion and $507 million, respectively. The corporations
divisions included Orthopaedic Implants, Medical and Surgical Equipment (MedSurg), Rehabilitative
Medical Services, and International Sales. Summary operating and financial data for Stryker as a
whole are presented in Exhibit 1.
MedSurg had 2002 sales of $1.1 billion, an increase of 13% over 2001, which came from three major
business units. Stryker Endoscopy produced video-imaging and communications equipment and
instruments for arthroscopic and general surgery. Stryker Medical produced hospital beds and other
patient-handling equipment along with emergency medical service products. Stryker Instruments
produced surgical instruments, operating room equipment and interventional pain control products.
Stryker Instruments operated manufacturing facilities in Michigan, Puerto Rico and Ireland and
recorded global revenues of approximately $430 million in 2002.
PCBs were used in virtually all of Instruments key products and platforms, sometimes in more
than one application. They were contained, for example, in instrument consoles, footswitches,
handpieces, chargers, docks, and monitors. Stryker had considered in-house manufacturing of PCBs
before a proposal had been developed as recently as 2001, but had not been executed. In 2003, as
supplier reliability continued to cause concern, the idea was once again receiving serious study.
The Proposal
An in-sourcing strategy had been studied in various forms so far and the proposal might change
further before implementation. In its current version the proposal called for the construction of a
new building with 30,000 square feet of space on eight acres owned by Stryker in Kalamazoo,
Michigan. Site preparation, construction and improvements were expected to cost $3,030,000. This
sum did not include architectural and engineering fees of $278,000. Furnishings and non-
manufacturing equipment would cost $126,000. Communication equipment and IT infrastructure
would cost an additional $210,000. The building would be ready for manufacturing equipment by
April 1, 2004.
The proposed facility would manufacture all of the various types of PCBs required by Stryker
Instruments and hence require many kinds of manufacturing equipment. Stryker Instruments
managers and engineers were already familiar with the requisite manufacturing processes and had
prepared detailed specifications for the needed equipment, including descriptions of equipment,
software, and related systems by model and manufacturer; specific configurations and options to be
included on the systems; quantities for each type; and installed costs. The total budget for about 70
separate categories of equipment was $2,643,258. Equipment was to be installed and ready for testing
by the end of the second quarter of 2004. Actual production would begin the third quarter of that
year.
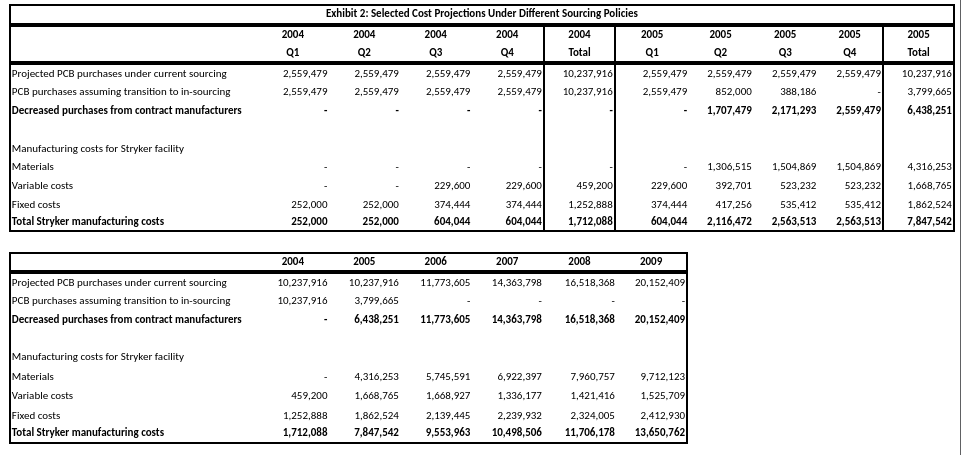
As Stryker Instruments began producing its own PCBs, it would transition out of supplier
agreements with third parties. This would happen fairly quickly: production transfers would take
place product by product and the transition would be complete by the end of 2005. Accordingly, for
part of 2004-05, Stryker would be manufacturing some PCBs while still buying some from outside
suppliers. Beginning in 2006, all PCBs would be produced in-house. Exhibit 2 shows Stryker
Instruments anticipated expenditures on PCBs for the period 2004-2009 under the old sourcing
strategy using contract manufacturers, including growth in volume and expected increases in the
suppliers prices. Exhibit 2 also shows the anticipated production schedule for the new facility as
currently proposed.
Strykers manufacturing costs were divided into three main categories: materials, variable costs
and fixed costs. Materials costs were estimated by product and based on actual costs reported under
existing supplier agreements, adjusted for expected price increases. These are presented in Exhibit 2
for the new facilitys anticipated production volume. Fixed costs were estimated by period for more
than 30 categories, including wages and salaries, overtime, benefits, training, depreciation, building
and equipment maintenance, office supplies, etc. Certain fixed costs would be incurred beginning in
the first quarter of 2004, even before the start of production. A summary of expected fixed costs,
including inflation and wage increases, is shown in Exhibit 2. Similarly, estimated variable costs for
more than 20 categories including wages, overtime, shipping supplies, scrap, etc., also are
summarized in Exhibit 2. Variable costs would begin to be incurred in the third quarter of 2004. Of
the combined fixed and variable costs shown in Exhibit 2, roughly half represented employee
compensation and benefits; by 2006 the facility was expected to employ 56 people.
The building would be depreciated on a straight-line basis over 30 years. Capital equipment
would be depreciated straight-line over seven years. IT equipment and other furnishings would be
depreciated over 3 years. These depreciation charges are included in the fixed costs summarized in
Exhibit 2. Also included are expected maintenance expenditures for both the building and
equipment, but not additional capital spending. Manufacturing volumes contemplated for 2009
represented 100% of the facilitys rated capacity.
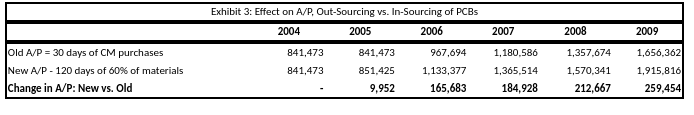
Finally, the project would benefit from terms of trade established with suppliers of certain PCB
components and materials. About 60% of the materials purchased by Stryker for manufacturing
PCBs would qualify for generous payment terms of net 120 days. Even better, the 120 days did not
commence until Stryker actually took a given component from its stock. In effect, the supplier owned
the component until that point, even though Stryker had physical possession of it. Further, the fact
that payment was not due for 120 days meant that Stryker typically would be paid for finished goods
by its customers before it was required to pay its materials supplier. Under existing arrangements
with contract manufacturers, the contract manufacturer benefited from this arrangement rather than
Stryker. Indeed, under the existing policy, Stryker paid its contract manufacturers much more
quicklyin 15 to 60 days, depending on the contract, for an average of about 30 days. Exhibit 3
presents a calculation of the anticipated change in accounts payable associated with the new sourcing
strategy.
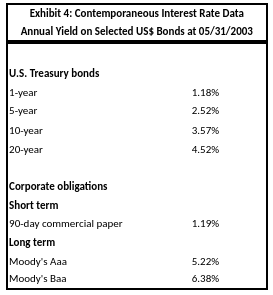
In its various financial analyses Stryker would apply a 36% tax rate. The company generally used
a hurdle rate of 15% for net present value calculations (for projects deemed riskier than usual a higher
rate would apply). Exhibit 4 presents selected capital market data as of May 2003.
Please show and explain the work, at the end of the day I want to learn how to do this. Thank You!
Exhibit 1: Selected Financial and Operating Data ($m, except employees) 2002 2001 2000 Net sales $3,012 $2,602 $2,2891 Gross profit 1,898 1,637 1,473 RD&E expense 144 124 SG&A expense 1,187 1.000 898 Operating profit 521 454 417 Net interest expense 66 Net earnings $329 $255 $211 144 41 98 $38 $50 $54 444 460 380 519 444 378 Cash & marketable securities Working capital Net PPE Capital expenditures Depreciation & Amortization Total Assets 139 162 81 172 169 186 2,838 502 2,441 2,439 723 1,013 866 LTD Shareholder equity Dividends # of employees 1,521 $24 1,072 $20 $16 14.045 12,839 12,084 2004 Exhibit 2: Selected Cost Projections Under Different Sourcing Policies 2004 2004 2004 2004 2005 Q2 Q3 Q4 Total Q1 2005 2005 2005 2005 Total Q1 Q2 Q3 Q4 2.559,479 2.559,479 2,559,479 Projected PCB purchases under current sourcing PCB purchases assuming transition to in-sourcing Decreased purchases from contract manufacturers 2,559,479 2,559.479 2,559,479 2,559,479 10,237,916 10,237,916 2,559,479 2.559.479 2,559,479 852,000 2.559,479 388,186 10,237.916 3,799,665 2,559,479 2,559,479 1,707,479 2,171,293 2,559,479 6,438,251 Manufacturing costs for Stryker facility Materials Variable costs 1,306,515 1.504.869 1,504.869 4,316,253 229,600 459,2001 1,668.765 Fixed costs Total Stryker manufacturing costs 252,000 252.000 523,232 535.412 252.000 252,000 229.6001 374,444 604,044 374,444 604,044 229,600 374,444 604,044 1,252,888 1,712,088 392,701 417,256 2,116,472 523,232 535.412 2,563,513 1,862.524 7,847,542 2,563,513 2004 2005 2006 2007 2008 2009 10.237,916 10.237,916 11,773,605 14,363,798 16,518,368 20,152,409 Projected PCB purchases under current sourcing PCB purchases assuming transition to in-sourcing Decreased purchases from contract manufacturers 10.237,916 3,799,665 6,438,251 11,773,605 14,363,798 16,518,368 20,152,4091 4,316,253 5.745,591 6,922,397 7,960,757 9,712,1231 Manufacturing costs for Stryker facility Materials Variable costs Fixed costs Total Stryker manufacturing costs 459,200 1,668.765 1,668,927 1,336,177 1,421,416 1,525,709 1.252.888 1,712,088 1,862,524 7,847,542 2,139,445 9,553,963 2,239.932 10,498,506 2,324,005 11,706,178 2,412.9301 13,650,7621 Exhibit 3: Effect on A/P, Out-Sourcing vs. In-Sourcing of PCBs 2004 2005 2006 2007 2008 2009 841,473 841,473 1,656,362 Old A/P = 30 days of CM purchases New A/P - 120 days of 60% of materials Change in A/P: New vs. Old 841,473 851,425 9,952 967,694 1,133,377 165,683 1,180.586 1,365,514 184,928 1,357,674 1,570,341 212,667 1,915,816 259,454 Exhibit 4: Contemporaneous Interest Rate Data Annual Yield on Selected US$ Bonds at 05/31/2003 U.S. Treasury bonds 1-year 5-year 10-year 20-year 1.18% 2.5296 3.57% 4.52% 1.1996 Corporate obligations short term 90-day commercial paper Long term Moody's Aaa Moody's Baa 5.229 6.389 Exhibit 1: Selected Financial and Operating Data ($m, except employees) 2002 2001 2000 Net sales $3,012 $2,602 $2,2891 Gross profit 1,898 1,637 1,473 RD&E expense 144 124 SG&A expense 1,187 1.000 898 Operating profit 521 454 417 Net interest expense 66 Net earnings $329 $255 $211 144 41 98 $38 $50 $54 444 460 380 519 444 378 Cash & marketable securities Working capital Net PPE Capital expenditures Depreciation & Amortization Total Assets 139 162 81 172 169 186 2,838 502 2,441 2,439 723 1,013 866 LTD Shareholder equity Dividends # of employees 1,521 $24 1,072 $20 $16 14.045 12,839 12,084 2004 Exhibit 2: Selected Cost Projections Under Different Sourcing Policies 2004 2004 2004 2004 2005 Q2 Q3 Q4 Total Q1 2005 2005 2005 2005 Total Q1 Q2 Q3 Q4 2.559,479 2.559,479 2,559,479 Projected PCB purchases under current sourcing PCB purchases assuming transition to in-sourcing Decreased purchases from contract manufacturers 2,559,479 2,559.479 2,559,479 2,559,479 10,237,916 10,237,916 2,559,479 2.559.479 2,559,479 852,000 2.559,479 388,186 10,237.916 3,799,665 2,559,479 2,559,479 1,707,479 2,171,293 2,559,479 6,438,251 Manufacturing costs for Stryker facility Materials Variable costs 1,306,515 1.504.869 1,504.869 4,316,253 229,600 459,2001 1,668.765 Fixed costs Total Stryker manufacturing costs 252,000 252.000 523,232 535.412 252.000 252,000 229.6001 374,444 604,044 374,444 604,044 229,600 374,444 604,044 1,252,888 1,712,088 392,701 417,256 2,116,472 523,232 535.412 2,563,513 1,862.524 7,847,542 2,563,513 2004 2005 2006 2007 2008 2009 10.237,916 10.237,916 11,773,605 14,363,798 16,518,368 20,152,409 Projected PCB purchases under current sourcing PCB purchases assuming transition to in-sourcing Decreased purchases from contract manufacturers 10.237,916 3,799,665 6,438,251 11,773,605 14,363,798 16,518,368 20,152,4091 4,316,253 5.745,591 6,922,397 7,960,757 9,712,1231 Manufacturing costs for Stryker facility Materials Variable costs Fixed costs Total Stryker manufacturing costs 459,200 1,668.765 1,668,927 1,336,177 1,421,416 1,525,709 1.252.888 1,712,088 1,862,524 7,847,542 2,139,445 9,553,963 2,239.932 10,498,506 2,324,005 11,706,178 2,412.9301 13,650,7621 Exhibit 3: Effect on A/P, Out-Sourcing vs. In-Sourcing of PCBs 2004 2005 2006 2007 2008 2009 841,473 841,473 1,656,362 Old A/P = 30 days of CM purchases New A/P - 120 days of 60% of materials Change in A/P: New vs. Old 841,473 851,425 9,952 967,694 1,133,377 165,683 1,180.586 1,365,514 184,928 1,357,674 1,570,341 212,667 1,915,816 259,454 Exhibit 4: Contemporaneous Interest Rate Data Annual Yield on Selected US$ Bonds at 05/31/2003 U.S. Treasury bonds 1-year 5-year 10-year 20-year 1.18% 2.5296 3.57% 4.52% 1.1996 Corporate obligations short term 90-day commercial paper Long term Moody's Aaa Moody's Baa 5.229 6.389Step by Step Solution
There are 3 Steps involved in it
Step: 1

Get Instant Access to Expert-Tailored Solutions
See step-by-step solutions with expert insights and AI powered tools for academic success
Step: 2

Step: 3
Ace Your Homework with AI
Get the answers you need in no time with our AI-driven, step-by-step assistance
Get Started
Public Finance and Public Policy
Authors: Jonathan Gruber
4th edition
1429278455, 978-1429278454