Answered step by step
Verified Expert Solution
Link Copied!

Question

1 Approved Answer

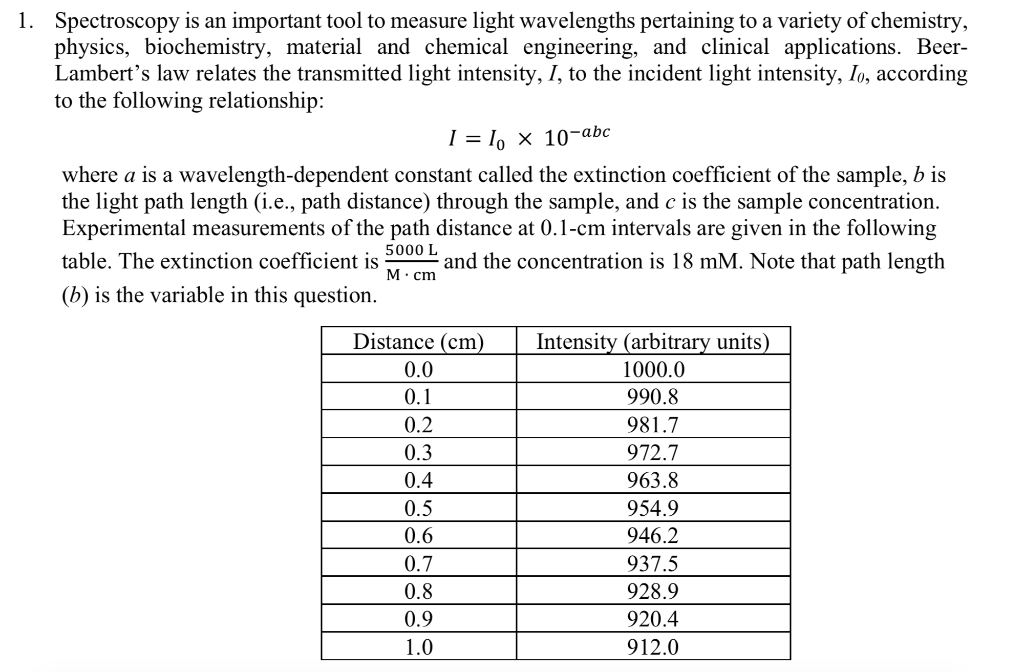
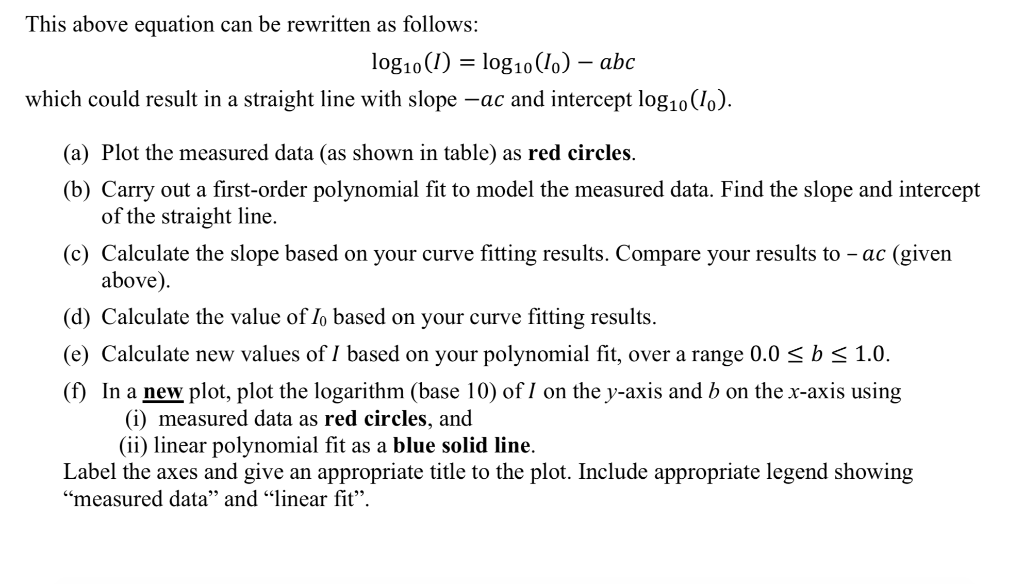
In MATLAB: 1. Spectroscopy is an important tool to measure light wavelengths pertaining to a variety of chemistry physics, biochemistry, material and chemical engineering, and

In MATLAB:

image text in transcribedimage text in transcribed

1. Spectroscopy is an important tool to measure light wavelengths pertaining to a variety of chemistry physics, biochemistry, material and chemical engineering, and clinical applications. Beer- Lambert's law relates the transmitted light intensity, I, to the incident light intensity, I, according to the following relationship: 1 = 10 10-abc where a is a wavelength-dependent constant called the extinction coefficient of the sample, b is the light path length (i.e., path distance) through the sample, and c is the sample concentration Experimental measurements of the path distance at 0.1-cm intervals are given in the following table. The extinction coefficient is (b) is the variable in this question 5000 L and the concentration is 18 mM. Note that path length M cm Distance (cm 0.0 0.2 0.3 0.4 0.5 0.6 0.7 0.8 0.9 Intensity (arbitrary units 1000.0 990.8 981.7 972.7 963.8 954.9 946.2 937.5 928.9 920.4 912.0 This above equation can be rewritten as follows: log1o (l) log1o(lo) -abc which could result in a straight line with slope -ac and intercept logio(lo.) (a) Plot the measured data (as shown in table) as red circles. (b) Carry out a first-order polynomial fit to model the measured data. Find the slope and intercept of the straight line. (c) Calculate the slope based on your curve fitting results. Compare your results to - ac (given above) (d) Calculate the value of Io based on your curve fitting results. (e) Calculate new values of I based on your polynomial fit, over a range 0.0 S b s 1.0. (f) In a new plot, plot the logarithm (base 10) of I on the y-axis and b on the x-axis using (i) measured data as red circles, and (ii) linear polynomial fit as a blue solid line. Label the axes and give an appropriate title to the plot. Include appropriate legend showing "measured data" and "linear fit

Step by Step Solution

There are 3 Steps involved in it

Step: 1

blur-text-image

Get Instant Access to Expert-Tailored Solutions

See step-by-step solutions with expert insights and AI powered tools for academic success

Step: 2

blur-text-image

Step: 3

blur-text-image

Ace Your Homework with AI

Get the answers you need in no time with our AI-driven, step-by-step assistance

Get Started

Students also viewed these Databases questions

Question

8. Demonstrate aspects of assessing group performance

Answered: 1 week ago