In Matlab

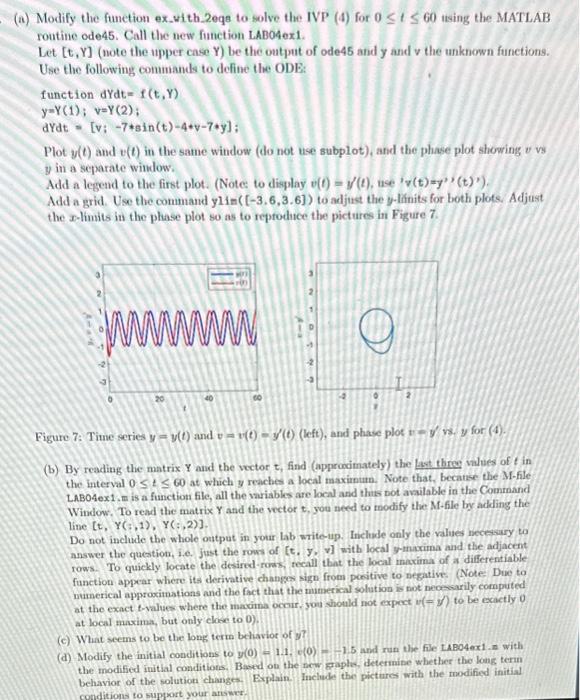
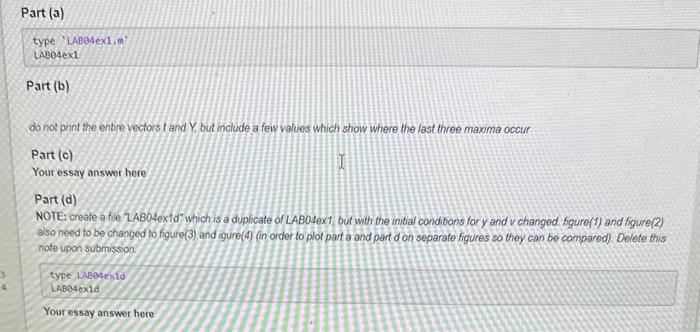
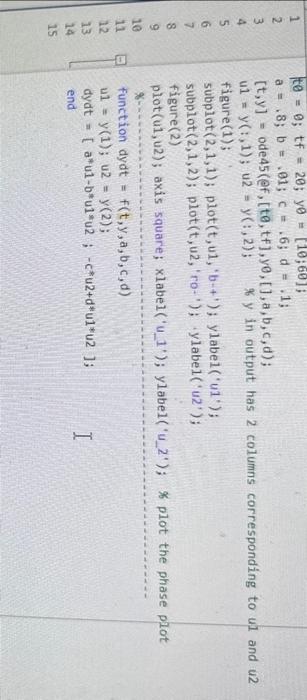
(a) Modify the function ex.with.2eqs to solve the IVP (4) for 0t60 ising the MATLAB routine ode45. Call the new function LAB04ex1. Let [t,Y] (note the upper case Y ) be the output of ode45 and y and v the unknown functions. Use the following commands to define the ODE: function dYdt=f(t,Y) y=Y(1);v=Y(2); dYdt=[v;7sin(t)4v7y] Plot y(t) and v(t) in the same window (do not use subplot), and the phase plot showing vva y in a separate window: Add a legend to the first plot. (Notee to dieplay v(t)=y(t), use ' v(t)=y(t)). Add a grid. Use the command ylin ([3,6,3.6]) to adjust the y-lifnits for both plots. Adjust the x-limits in the phase plot so as to reprodice the pictures in Figure 7. Figure 7: Time series y=y(t) and v=v(t)=y(t) (left), and phase plot vy/v3. y for (4). (b) By reading the matrix Y and the vector t, find (approximately) the last thres values of t in the interval 0t60 at which y reaches a local maxinum. Note that, becanse the M-file LABO4ex1. m is a function file, all the variables are local and this pot available in the Command Window. To read the matrix Y and the vector t, you need to modify the M-file by adding the line (t,Y(i,1),Y(i,2)]. Do not include the whole outpat in your lab writeup. Include only the valued necensary to answer the question, i.e. just the roms of [t,y,v] with local y-maxima and the adjacent rows. To quickly locate the desired-roas recall that the local micxima of a differentiable function appear where its derivative changes sign from peritive to negative (Note Due to nuimerical approximations and the fact that the mumerical solution is not necosirily computed at the exact t-values where the naxind ocnur. you shothld not expect v(=y) to be exactly 0 at local maxima, but only clowe to 0 ). (c) What seems to be the long term behaviot of y ? (d) Modify the initial conditions to y(0)=1.1.C(0)=1.5 and run the file taBo4ex1.n with the modified initial conditions. Based ou the thew eraple, deternipe whether the lons tern behavior of the solution changes Explain Include the pictures with the modified initial conditions to suptort your answer? NOTE: create a fie LABO4exid" which is a duplicate of LABO4ex1, but with the initial conditans for y and v changed. figure(1) and figure(2) also need to be changed to figure(3) and igure(4) (in order to plot part a and part d on separate figures so they can be compared). Dolete this note upon submission


