Answered step by step
Verified Expert Solution
Question
1 Approved Answer
IN MATLAB BMI = 34.6021 31.9559 24.1870 30.8444 38.7543 22.2222 30.8248 30.7174 26.8612 MAP = 62.3333 105.6667 76.3333 88.3333 83.6667 123.0000 93.6667 80.0000 69.3333 In
IN MATLAB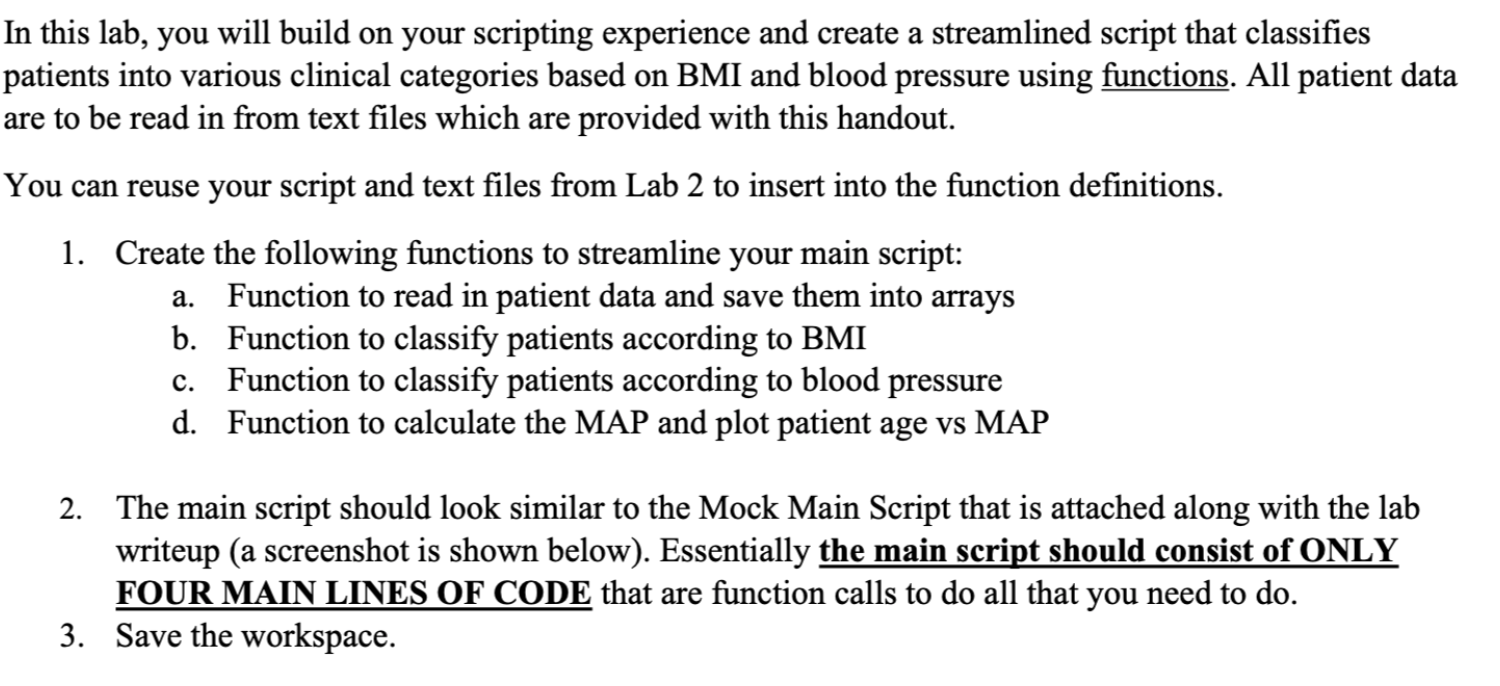
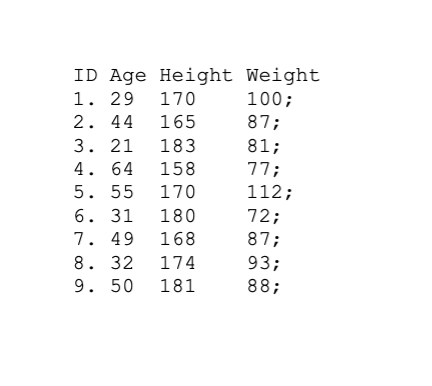
BMI = 34.6021 31.9559 24.1870 30.8444 38.7543 22.2222 30.8248 30.7174 26.8612
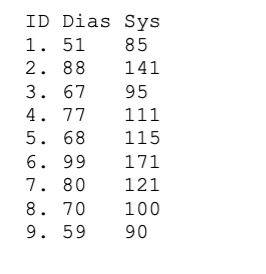
MAP = 62.3333 105.6667 76.3333 88.3333 83.6667 123.0000 93.6667 80.0000 69.3333
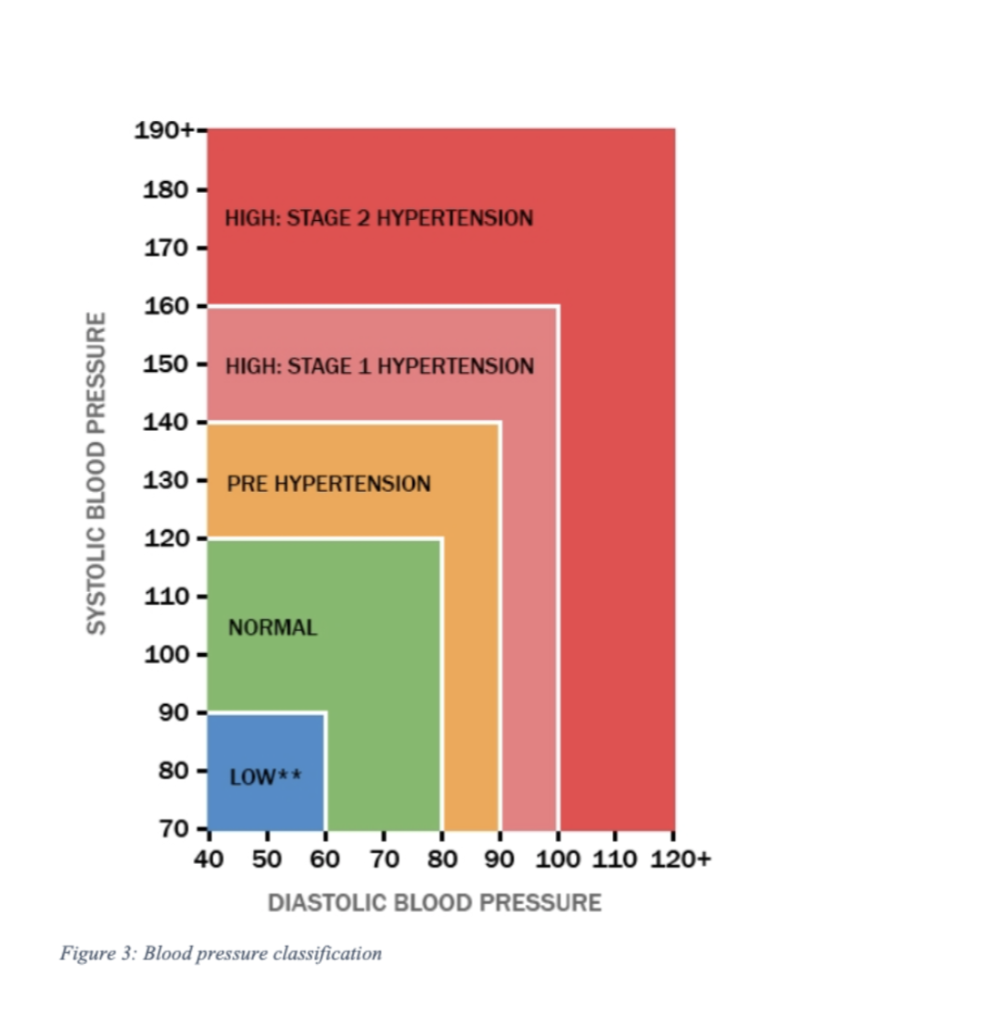
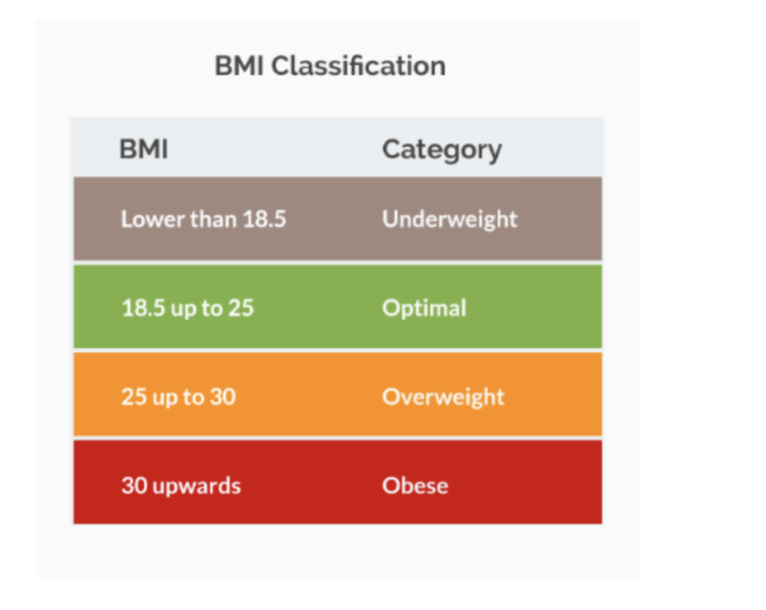
In this lab, you will build on your scripting experience and create a streamlined script that classifies patients into various clinical categories based on BMI and blood pressure using functions. All patient data are to be read in from text files which are provided with this handout. You can reuse your script and text files from Lab 2 to insert into the function definitions. 1. Create the following functions to streamline your main script: a. Function to read in patient data and save them into arrays b. Function to classify patients according to BMI c. Function to classify patients according to blood pressure d. Function to calculate the MAP and plot patient age vs MAP 2. The main script should look similar to the Mock Main Script that is attached along with the lab writeup (a screenshot is shown below). Essentially the main script should consist of ONLY FOUR MAIN LINES OF CODE that are function calls to do all that you need to do. 3. Save the workspace. 77; ID Age Height Weight 1. 29 170 100; 2. 44 165 87; 3. 21 183 81; 4. 64 158 5. 55 170 112; 6. 31 180 72; 7. 49 168 8. 32 174 9. 50 181 88; 87; 93; ID Dias Sys 1. 51 85 2. 88 141 3. 67 95 4. 77 111 5. 68 115 6. 99 171 7. 80 121 8. 70 100 9. 59 90 190+- 180 - HIGH: STAGE 2 HYPERTENSION 170 160 150 - HIGH: STAGE 1 HYPERTENSION 140 SYSTOLIC BLOOD PRESSURE 130 - PRE HYPERTENSION 120 - 110 NORMAL 100 - 90 - 80 LOW** 70-1 40 50 60 70 80 90 100 110 120+ DIASTOLIC BLOOD PRESSURE Figure 3: Blood pressure classification BMI Classification BMI Category Lower than 18.5 Underweight 18.5 up to 25 Optimal 25 up to 30 Overweight 30 upwards Obese In this lab, you will build on your scripting experience and create a streamlined script that classifies patients into various clinical categories based on BMI and blood pressure using functions. All patient data are to be read in from text files which are provided with this handout. You can reuse your script and text files from Lab 2 to insert into the function definitions. 1. Create the following functions to streamline your main script: a. Function to read in patient data and save them into arrays b. Function to classify patients according to BMI c. Function to classify patients according to blood pressure d. Function to calculate the MAP and plot patient age vs MAP 2. The main script should look similar to the Mock Main Script that is attached along with the lab writeup (a screenshot is shown below). Essentially the main script should consist of ONLY FOUR MAIN LINES OF CODE that are function calls to do all that you need to do. 3. Save the workspace. 77; ID Age Height Weight 1. 29 170 100; 2. 44 165 87; 3. 21 183 81; 4. 64 158 5. 55 170 112; 6. 31 180 72; 7. 49 168 8. 32 174 9. 50 181 88; 87; 93; ID Dias Sys 1. 51 85 2. 88 141 3. 67 95 4. 77 111 5. 68 115 6. 99 171 7. 80 121 8. 70 100 9. 59 90 190+- 180 - HIGH: STAGE 2 HYPERTENSION 170 160 150 - HIGH: STAGE 1 HYPERTENSION 140 SYSTOLIC BLOOD PRESSURE 130 - PRE HYPERTENSION 120 - 110 NORMAL 100 - 90 - 80 LOW** 70-1 40 50 60 70 80 90 100 110 120+ DIASTOLIC BLOOD PRESSURE Figure 3: Blood pressure classification BMI Classification BMI Category Lower than 18.5 Underweight 18.5 up to 25 Optimal 25 up to 30 Overweight 30 upwards ObeseStep by Step Solution
There are 3 Steps involved in it
Step: 1

Get Instant Access to Expert-Tailored Solutions
See step-by-step solutions with expert insights and AI powered tools for academic success
Step: 2

Step: 3

Ace Your Homework with AI
Get the answers you need in no time with our AI-driven, step-by-step assistance
Get Started


