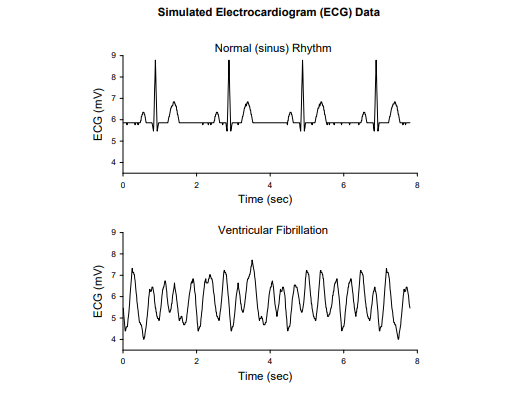
- IN MATLAB create the following graph of the normal and ventricular fibrillation data (ECG.txt) as two separate plots (see below). Include the graph in
- IN MATLAB create the following graph of the normal and ventricular fibrillation data (ECG.txt) as two separate plots (see below). Include the graph in your laboratory report. Please attach code from matlab!

Here is a shortened version of the ECG.txt file (the whole thing was too long to paste):
0.01 5.85938 5.46875 0.02 5.85938 5.17578 0.03 5.85938 4.98047 0.04 5.85938 4.78516 0.05 5.85938 4.58984 0.06 5.85938 4.39453 0.07 5.85938 4.39453 0.08 5.85938 4.49219 0.09 5.85938 4.58984 0.1 5.85938 4.58984 0.11 5.76172 4.58984 0.12 5.85938 4.58984 0.13 5.85938 4.78516 0.14 5.85938 4.98047
Simulated Electrocardiogram (ECG) Data Normal (sinus) Rhythm Time (sec) Ventricular Fibrillation Time (sec)Step by Step Solution
There are 3 Steps involved in it
Step: 1

See step-by-step solutions with expert insights and AI powered tools for academic success
Step: 2

Step: 3

Ace Your Homework with AI
Get the answers you need in no time with our AI-driven, step-by-step assistance
Get Started


