

Answered step by step
Verified Expert Solution
Question
1 Approved Answer
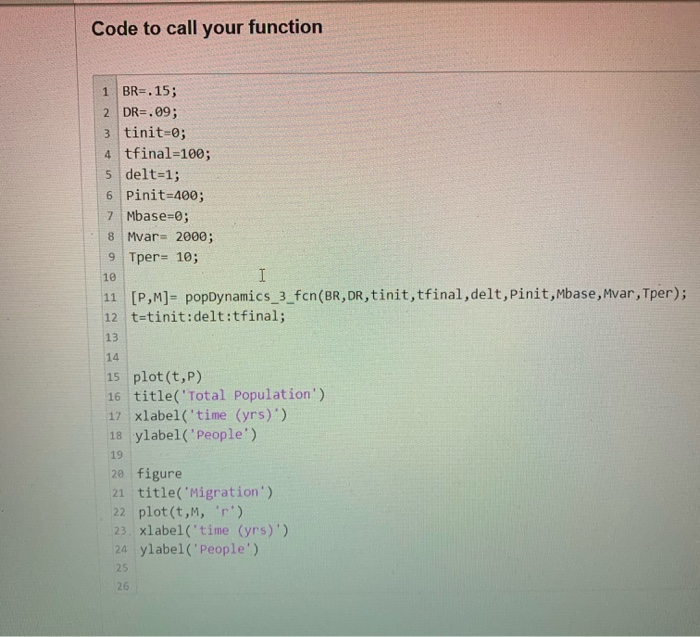
In Matlab's Language: create a function that projects population based on static: Birth Rate (BR), Death Rate (DR). Migration will vary sinesoidally with time. Migration
In Matlab's Language: create a function that projects population based on static: Birth Rate (BR), Death Rate (DR). Migration will vary sinesoidally with time. Migration is given by the function M(t)=Mbase+Mvar*sin(2*pi*t/Tper), where Mbase is the base migration rate, Mvar is the variance in migration and Tper is the period in time over which it varies. A template for the function has been provided. Please do not change variable names as this will result in an incorrect answer. 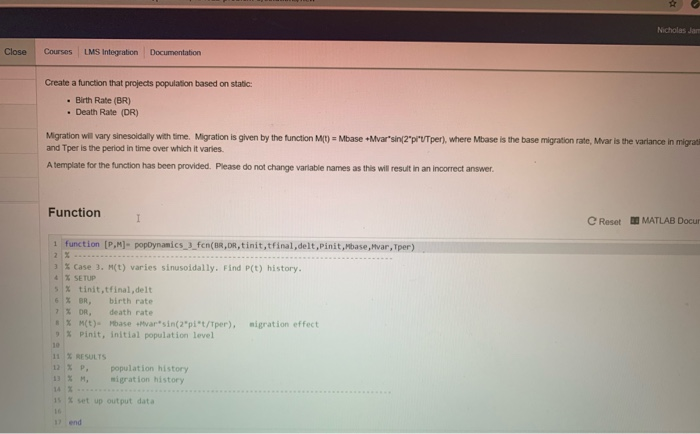
Step by Step Solution
There are 3 Steps involved in it
Step: 1

Get Instant Access to Expert-Tailored Solutions
See step-by-step solutions with expert insights and AI powered tools for academic success
Step: 2

Step: 3
Ace Your Homework with AI
Get the answers you need in no time with our AI-driven, step-by-step assistance
Get Started
Professional Microsoft SQL Server 2012 Administration
Authors: Adam Jorgensen, Steven Wort
1st Edition
1118106881, 9781118106884