

Answered step by step
Verified Expert Solution
Question
1 Approved Answer
In Matlab's Language: create a function that projects population based on static: Annual Migration(Mann) & variable Birth Rate (BR) and Death Rate (DR). Birth and
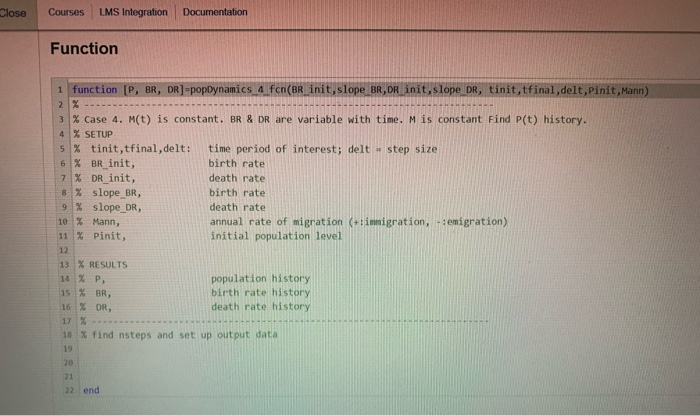
In Matlab's Language: create a function that projects population based on static: Annual Migration(Mann) & variable Birth Rate (BR) and Death Rate (DR). Birth and death rates will be represented as a linear function over time having initial values(BR_init & DR_init), and slopes (slope_BR & slope_DR). A sample of this relationship is given below. A template for the function has been provided. Please do not change variable names as this will result in an incorrect answer. 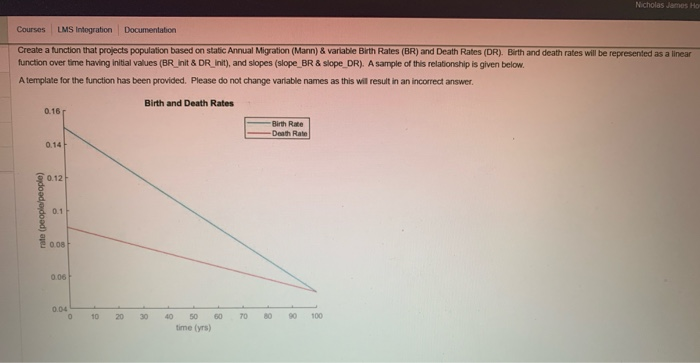

Step by Step Solution
There are 3 Steps involved in it
Step: 1

Get Instant Access to Expert-Tailored Solutions
See step-by-step solutions with expert insights and AI powered tools for academic success
Step: 2

Step: 3
Ace Your Homework with AI
Get the answers you need in no time with our AI-driven, step-by-step assistance
Get Started
Professional Microsoft SQL Server 2014 Integration Services
Authors: Brian Knight, Devin Knight
1st Edition
1118850904, 9781118850909