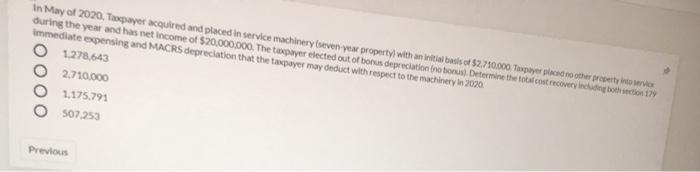
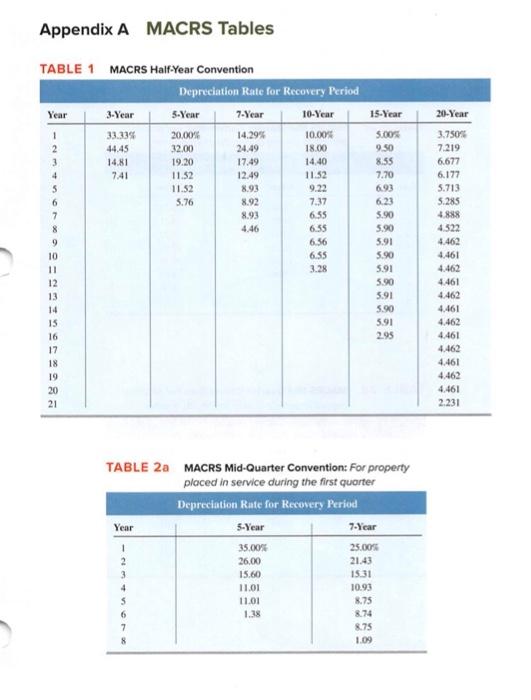
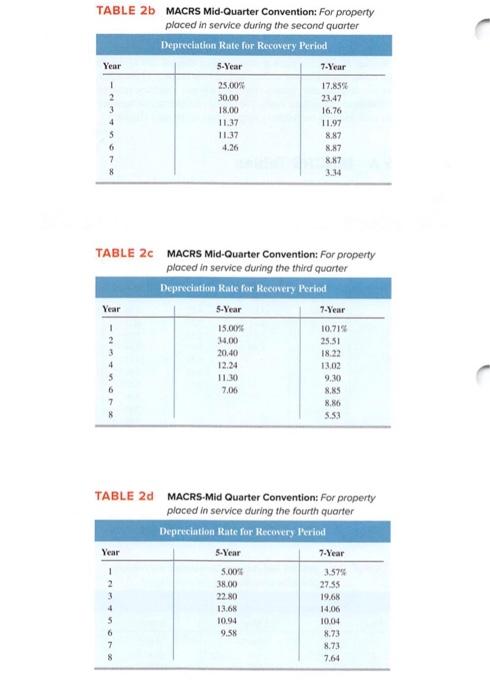
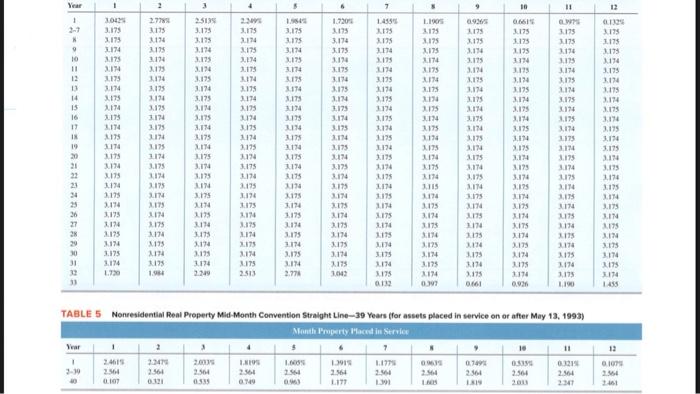
In May of 2020, Tapayer acquired and placed in service machinery (seven your property with an initial basis of $2,710.000. Tanpayer placed to other party during the year and has net income of $20,000,000. The taxpayer elected out of bonus depreciation (no bonus. Determine the total cost recovery mode in 179 Immediate expensing and MACRS depreciation that the taxpayer may deduct with respect to the machinery in 2020. O 1.278.643 2,710.000 1.175.791 507253 Previous Appendix A MACRS Tables 15-Year 20-Year 5.00% 9.50 8.55 7.70 TABLE 1 MACRS Half-Year Convention Depreciation Rate for Recovery Period Year 3-Year 5-Year 7-Year 10-Year 1 33.33% 20.00% 14.29% 10.00% 2 44.45 32.00 24.49 18.00 3 14.81 19.20 17.49 14.40 4 7.41 11.52 12.49 11.52 5 11.52 8.93 9.22 6 5.76 8.92 7.37 7 8.93 6.55 8 4.46 6.35 9 6.56 10 6.55 11 3.28 12 13 14 15 16 17 18 19 20 21 6.23 5.90 5.90 5.91 5.90 5.91 5.90 5.91 5.90 3.91 2.95 3.750 7.219 6677 6.177 5.713 5.25 4.888 4.522 4.462 4.461 4.462 4.461 4.462 4.461 4.462 4.461 4.462 4.461 4.462 4.461 2.231 TABLE 2a MACRS Mid-Quarter Convention: For property placed in service during the first quarter Depreciation Rate for Recovery Period 5-Year 7-Year 35.00% 25.00% 21.43 Year 1 2 3 4 5 6 7 8 26.00 15.60 11.01 11.01 1.38 15.31 10.93 8.75 8.74 8.75 1.09 TABLE 26 MACRS Mid-Quarter Convention: For property placed in service during the second quarter Depreciation Rate for Recovery Period Year 5-Year 7-Year 1 25,00% 17.85% 30,00 23.47 3 18.00 16.76 11.37 11.97 5 11.37 8.87 6 4.26 8.87 8X7 TABLE 2 MACRS Mid-Quarter Convention: For property placed in service during the third quarter Depreciation Rate for Recovery Period Year 5-Year 7-Year 1 15.00 10.71 2 14.00 25.51 20,40 18.22 12.24 13.02 5 11 9.30 7.06 8.85 8.86 5.53 4 TABLE 2d MACRS-Mid Quarter Convention: For property placed in service during the fourth quarter Depreciation Rate for Recovery Period Year 5-Year 3.575 7-Year 1 5.00% 38.00 22.80 13.68 10.94 4 27.55 19.68 14.05 10.04 8.73 8.73 9.58 6 7 8 7.64 8 10 12 *2991 1.165 3.616 07585 0.4559 EVE 99E STIE WE LIVE 99 w 996 0.1525 3.636 1616 1637 1901 RE 99 LIVE WE LEVE ME 49 NYE LET 99 LIVE VE 99 LEVE ME 3.637 3616 LEVE RE VE LEVE 99 LEVE 99 LEVE 99 VE 29 LIVE TABLE 3 Residential Rental Property Mid-Month Convention Straight Line-27.5 Years Month Property Maced in Service Year 1 5 7 1 3.4855 2.879% 2.57 22735 1.970 3.6% 3.636 10 3.637 3.637 3.617 3.636 11 3.6.36 3.636 3.6.36 3.637 12 3.637 3.637 3637 3637 3.616 13 3.636 3636 3.617 14 2637 1617 36.37 16:37 15 3.636 3.636 16 17 3.636 16M 3.636 3637 18 3637 1617 36M 19 1616 3.636 16M 3.636 361 20 3637 2637 1.637 3.637 3637 21 1616 3.636 3.636 3.636 3.66 22 1637 3637 1.637 3.617 1616 1616 1.616 3637 3.637 25 1636 16M 3.617 26 1637 3.637 361 1636 27 3.616 26 28 1.97 2.576 2.579 JA16 29 0.152 99 99 99 LIVE SVE LIVE 996 LEVE WWE LVC 99 LEVE 99 E 16.16 3.617 3.636 3636 3,037 3.636 3637 LEVE LEVE 29 1436 99 LEVE WE LE WWE 36 1.637 3616 1617 366 1,637 3.636 3.637 LIVE WY LIVE VC LEVE LEVE LEVE WE 3.637 2.636 3.637 3617 3.636 3.637 3.636 3.637 3.616 1637 3.636 3.637 1.636 1637 1636 99% LIVE 99 LEVE WE LEVE WWE 3637 WE LEVE ET 16 EVE LEY 99% WE LEVE 99 LIVE WWE LIVE LIVE 1617 361 1637 VE 1616 LOVE WWE LIVE WE WY LIVE 3637 16M LIVE wy LE WE LIVE WE KLET K 3617 3.636 1617 1616 3637 16M 0.75 1637 BAM THI NAM 1964 SSPO 1.061 291 ONI CE 1977 19 OP 1997 SIRO OLO 1953 1 SOCI SRO 12 2.564 2361 2564 2564 256 2.561 2.564 0.709 3-99 1.177 2347 2.4615 1 11 7 2 Monthperty laced in Servies TABLE 5 Nonresidential Real Property Mid Month Convention Straight Line-39 Years for assets placed in service on or after May 13, 1993) 1970 SLIKE 097 012 39 3.174 2175 SLR 2.774 LIN TE MIX SIT HIT NIE PIE SLIX LIE SLIK PIT SI NO PLEX Su NY SIC IT SLI PLY SIE NI CRY PLIE SL PLIE Sur SLEY PIT SLIS RIT SEIT PIT SLEX 1125 3.114 1195 2.114 CHOE SLEY LIE SLIE PLIE CLIC LE SLI IN 1178 LIN 3.17 1114 FIST SLE TE SLIK PIT SIE NIY SLIE PIE SLI PIE SLIC PIE SLIE PIE SLI PI PASI SCE TY SCI LIE SLIK NIT SLIK SLIE PIE SIE PIE SI PI SUIT PIE 195 31 30 20 28 27 26 BET NIY SIE TIL SLIK MIX SLIT PLE SLEE HIT SIT NIE SLIE TIE SLI 3174 3.175 SITE LIN 1.175 23 219 2114 1175 3194 3.175 SEIT TE SERE PC SLIK NIE SCI NIE SLIT SLI NIE SLEY PLIT SLITE PLIT 2174 175 1194 SIT 3.19 1.195 14 2175 2.175 1174 3.175 1.173 3.IN 2.15 1 PIE Sur PIE SIE NI NIK SIE NIE SLIK E SERY MIT SIT PIC SLIX KIY PIC SKIY SUIT PIT 2194 3.175 MIE SLE LIE SLIE PIE SLIE PIE PLE SLEE PIE SLR he PIE SLIE LY SI LIT SLIE NIE SLIY PLE SLIK LEY SER 1175 2.114 3.175 20 19 18 17 16 15 14 2174 2175 2174 2179 1114 3.175 2.195 PIE SLR TIC SLE LIE SC 2114 PIE SUIT SIE SIE LIE PIE SLI 3174 2173 1174 3.175 1194 3174 SLR PUIT SCIE HE 3.134 1 2.194 3.125 PIE SLIK 3.179 2174 2175 2174 LITS 2.174 2175 SER 2125 3.124 3.175 SR RE SIE NIY SLIK LIY SLIT SLIK SIY 3.194 2.119 2194 PIE SLIE NEE SIT ELIT 174 12 11 10 1 3.114 1.195 3,194 3.175 3.174 2175 1.720 3199 2174 3.17 PE SLIC SIY PLIT FLIX PIE SIT TRY SIE SALT SIE PIC SLI SLI SLIK SID NIE 0 SLI SLIE SLI 3.175 SLIE PIE SLIK SLIE SO 1175 0661 10 SI SSS SLIE SLIT SALE SIE SEISZ 1 11 1 Year