

Question
In my opinion, the answer is C and D. Can someone help me to see if my answer is correct? If not, can you point
In my opinion, the answer is C and D. Can someone help me to see if my answer is correct? If not, can you point out the correct answer and explain it in detail.
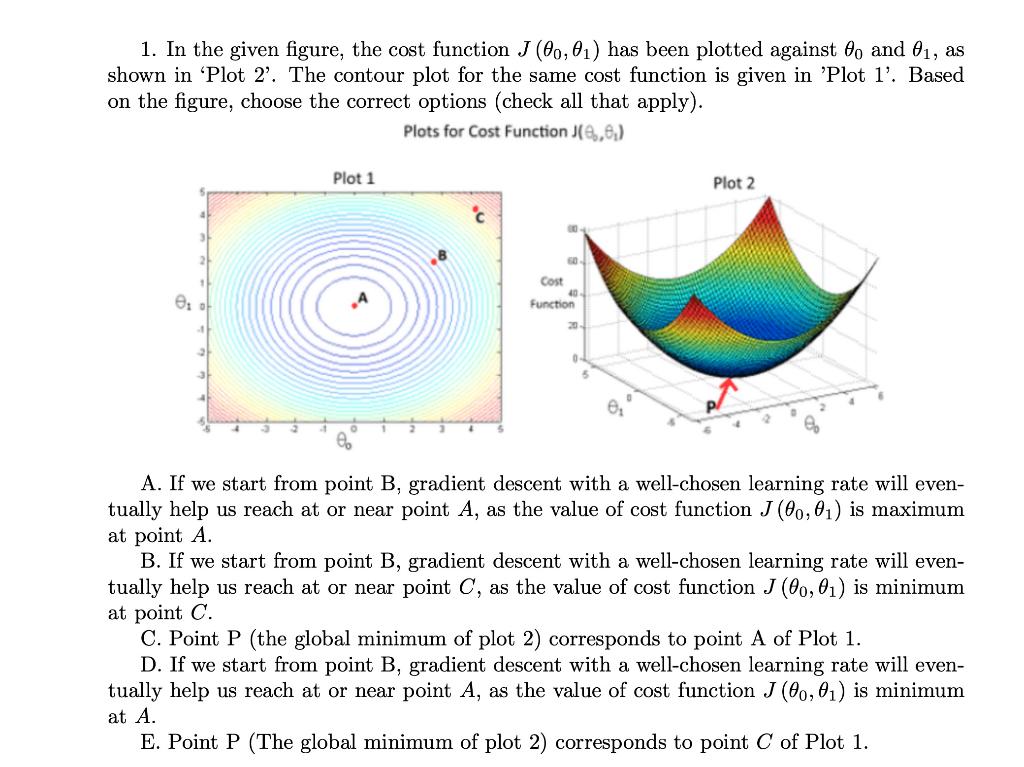
1. In the given figure, the cost function J(0,1) has been plotted against 0 and 1, as shown in 'Plot 2'. The contour plot for the same cost function is given in 'Plot 1'. Based on the figure, choose the correct options (check all that apply). Plots for Cost Function J(2,1) A. If we start from point B, gradient descent with a well-chosen learning rate will eventually help us reach at or near point A, as the value of cost function J(0,1) is maximum at point A. B. If we start from point B, gradient descent with a well-chosen learning rate will eventually help us reach at or near point C, as the value of cost function J(0,1) is minimum at point C. C. Point P (the global minimum of plot 2) corresponds to point A of Plot 1. D. If we start from point B, gradient descent with a well-chosen learning rate will eventually help us reach at or near point A, as the value of cost function J(0,1) is minimum at A. E. Point P (The global minimum of plot 2 ) corresponds to point C of Plot 1
Step by Step Solution
There are 3 Steps involved in it
Step: 1

Get Instant Access to Expert-Tailored Solutions
See step-by-step solutions with expert insights and AI powered tools for academic success
Step: 2

Step: 3
Ace Your Homework with AI
Get the answers you need in no time with our AI-driven, step-by-step assistance
Get Started
Machine Learning And Knowledge Discovery In Databases European Conference Ecml Pkdd 2018 Dublin Ireland September 10 14 2018 Proceedings Part 1 Lnai 11051
Authors: Michele Berlingerio ,Francesco Bonchi ,Thomas Gartner ,Neil Hurley ,Georgiana Ifrim
1st Edition
3030109240, 978-3030109240