Question
In order to copy the contents of the data table below into a spreadsheet: perform the following: a. Calculate the tax liability, after-tax earnings, and

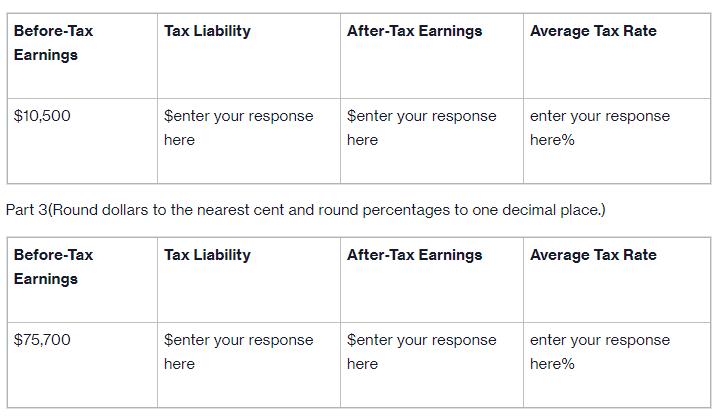
perform the following:a. Calculate the tax liability, after-tax earnings, and average tax rates for the following levels of partnership earnings before taxes:
$10,500;
$75,700;
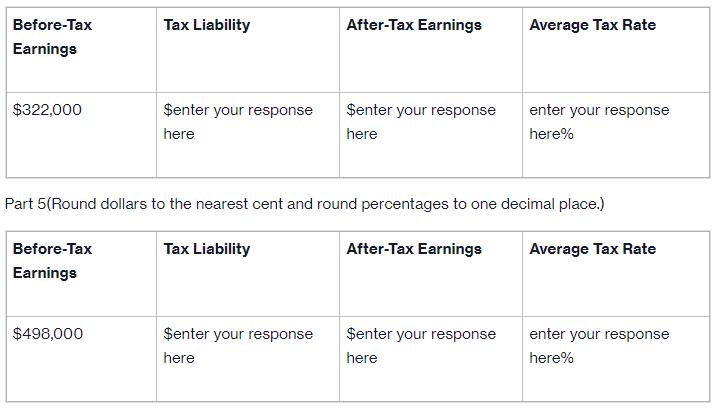
$322,000;
$498,000;
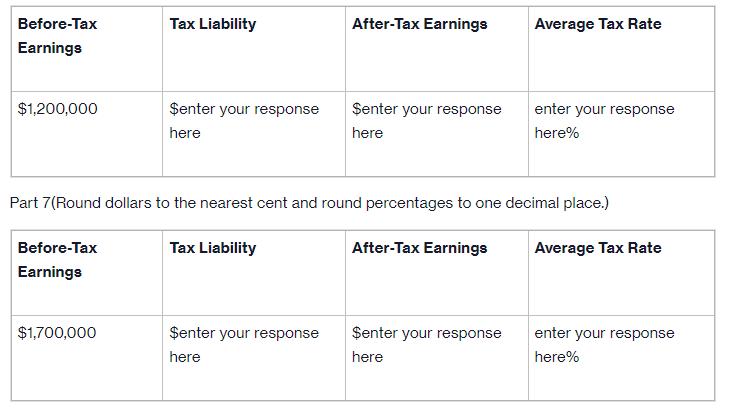
$1.2
million;
$1.7
million; and
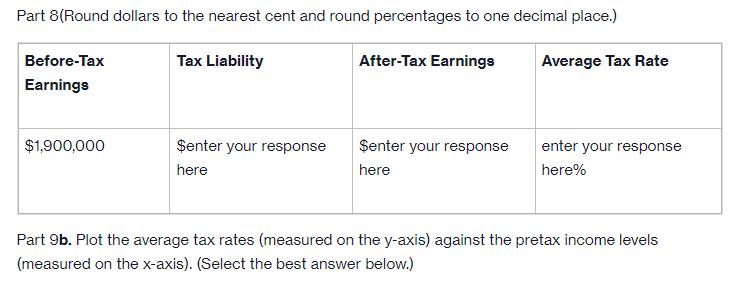
$1.9
million.b. Plot the average tax rates (measured on the y-axis) against the pretax income levels (measured on the x-axis). What generalization can be made concerning the relationship between these variables?
a. Calculate the tax liability, after-tax earnings, and average tax rates for the following levels of partnership earnings before taxes:
$10,500;
$75,700;
$322,000;
$498,000;
$1.2
million;
$1.7
million; and
$1.9
million.Part 2(Round dollars to the nearest cent and round percentages to one decimal place.)

Part 4(Round dollars to the nearest cent and round percentages to one decimal place.)

Part 6(Round dollars to the nearest cent and round percentages to one decimal place.)


Part 9b. Plot the average tax rates (measured on the y-axis) against the pretax income levels (measured on the x-axis). (Select the best answer below.)
A.
00.511.50510152025303540Income ($ millions)Average Tax Rate (%)
x y graph
B.
00.511.50510152025303540Income ($ millions)Average Tax Rate (%)
x y graph
C.
00.511.50510152025303540Average Tax Rate (%)Income ($ millions)
x y graph
D.
02500.511.5Income ($ millions)Average Tax Rate (%)
x y graph
Part 10What generalization can be made concerning the relationship between these variables? (Select the best answer below.)
A.
Under the new tax law, the partnership's average tax rate remains 37% once income is more than $500,000.
B.
Under the new tax law, the partnership's average tax rate gets closer to 37% as income goes lower.
C.
Under the new tax law, the partnership's average tax rate gets closer to 37% as income goes higher.
D.
Under the new tax law, the partnership's average tax rate gets closer to 10% as income goes higher.
TABLE 1.2: Federal Income Tax Rates and Brackets for Individual Returns (2018) Taxable Income $0 to $9,875 $9,876 to $40,125 $40,126 to $85,525 $85,526 to $163,300 $163,301 to $207,350 $207,351 to $518,400 Over $518,401 Tax Rates 10.0% 12.0% 22.0% 24.0% 32.0% 35.0% 37.0% Taxes 10% of taxable income $987.50, plus 12% of the amount over $9,875 $4,617.50, plus 22% of the amount over $40,125 $14,605.50, plus 24% of the amount over $85,525 $33,271.50, plus 32% of the amount over $163,300 $47,367.50, plus 35% of the amount over $207,350 $156,235.50, plus 37% of the amount over $518,400
Step by Step Solution
3.40 Rating (150 Votes )
There are 3 Steps involved in it
Step: 1
To calculate the tax liability aftertax earnings and average tax rates for the given levels of partn...
Get Instant Access to Expert-Tailored Solutions
See step-by-step solutions with expert insights and AI powered tools for academic success
Step: 2

Step: 3

Ace Your Homework with AI
Get the answers you need in no time with our AI-driven, step-by-step assistance
Get Started


