Answered step by step
Verified Expert Solution
Question
1 Approved Answer
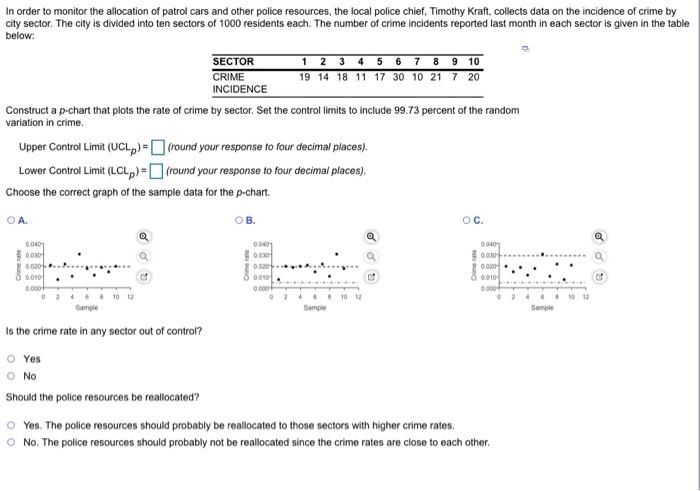
In order to monitor the allocation of patrol cars and other police resources, the local police chief, Timothy Kraft, collects data on the incidence

In order to monitor the allocation of patrol cars and other police resources, the local police chief, Timothy Kraft, collects data on the incidence of crime by city sector. The city is divided into ten sectors of 1000 residents each. The number of crime incidents reported last month in each sector is given in the table below: Construct a p-chart that plots the rate of crime by sector. Set the control limits to include 99.73 percent of the random variation in crime. 0040 0.030 0.020 0.010 0.000+ Upper Control Limit (UCLp)=(round your response to four decimal places). Lower Control Limit (LCLp) = (round your response to four decimal places). Choose the correct graph of the sample data for the p-chart. O.A. 0246 10 12 Sample a SECTOR CRIME INCIDENCE Is the crime rate in any sector out of control? O Yes O No Should the police resources be reallocated? OB. 1 2 3 4 5 6 7 8 9 10 19 14 18 11 17 30 10 21 7 20 0.000 0.030 0.020 0.010 0.000+ 024 Sample 10 12 Q M OC. 0040 0030 0.020 0.000+ Yes. The police resources should probably be reallocated to those sectors with higher crime rates. O No. The police resources should probably not be reallocated since the crime rates are close to each other. Sample odb
Step by Step Solution
★★★★★
3.44 Rating (147 Votes )
There are 3 Steps involved in it
Step: 1
Answer UCLp 00289 LCLp 00045 Explanation Day Defectives Observations 1 19 1000 2 14 1000 3 18 1000 4 ...
Get Instant Access to Expert-Tailored Solutions
See step-by-step solutions with expert insights and AI powered tools for academic success
Step: 2

Step: 3

Ace Your Homework with AI
Get the answers you need in no time with our AI-driven, step-by-step assistance
Get Started


