- In page 161 of the Annual report of 2019, you will find Balance Sheets of Philips. Thru that make a comparison and identify the differences between FASB and IASB standards . (Only balance sheet standpoint) (5 Marks)
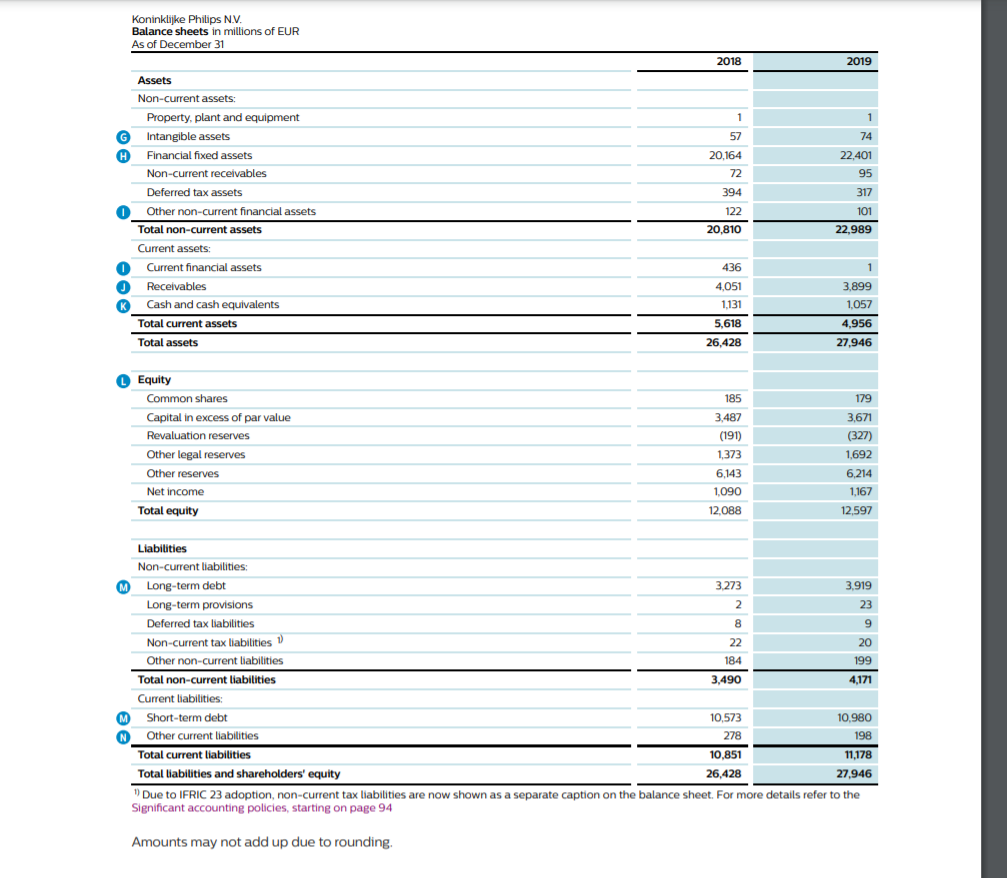
Koninklijke Philips N.V. Balance sheets in millions of EUR As of December 31 2018 2019 1 Assets Non-current assets: Property, plant and equipment Intangible assets H Financial fixed assets Non-current receivables Deferred tax assets 0 Other non-current financial assets Total non-current assets - Current assets: 0 Current financial assets J Receivables K Cash and cash equivalents Total current assets Total assets 57 20,164 72 394 122 20,810 1 74 22,401 95 317 101 22,989 436 4,051 1,131 5,618 26,428 1 3,899 1,057 4,956 27,946 185 Equity Common shares Capital in excess of par value Revaluation reserves Other legal reserves Other reserves Net income Total equity 3,487 (191) 1,373 179 3,671 (327) 1,692 6,214 1,167 12,597 6,143 1.090 12,088 M M Liabilities Non-current liabilities: Long-term debt 3.273 3.919 Long-term provisions 2 23 Deferred tax liabilities 8 9 Non-current tax liabilities 1) 22 20 Other non-current liabilities 184 199 Total non-current liabilities 3,490 4,171 Current liabilities: Short-term debt - 10.573 10,980 Other current liabilities 278 198 Total current liabilities 10,851 11,178 Total liabilities and shareholders' equity 26,428 27.946 Due to IFRIC 23 adoption, non-current tax liabilities are now shown as a separate caption on the balance sheet. For more details refer to the Significant accounting policies, starting on page 94 M N Amounts may not add up due to rounding. Koninklijke Philips N.V. Balance sheets in millions of EUR As of December 31 2018 2019 1 Assets Non-current assets: Property, plant and equipment Intangible assets H Financial fixed assets Non-current receivables Deferred tax assets 0 Other non-current financial assets Total non-current assets - Current assets: 0 Current financial assets J Receivables K Cash and cash equivalents Total current assets Total assets 57 20,164 72 394 122 20,810 1 74 22,401 95 317 101 22,989 436 4,051 1,131 5,618 26,428 1 3,899 1,057 4,956 27,946 185 Equity Common shares Capital in excess of par value Revaluation reserves Other legal reserves Other reserves Net income Total equity 3,487 (191) 1,373 179 3,671 (327) 1,692 6,214 1,167 12,597 6,143 1.090 12,088 M M Liabilities Non-current liabilities: Long-term debt 3.273 3.919 Long-term provisions 2 23 Deferred tax liabilities 8 9 Non-current tax liabilities 1) 22 20 Other non-current liabilities 184 199 Total non-current liabilities 3,490 4,171 Current liabilities: Short-term debt - 10.573 10,980 Other current liabilities 278 198 Total current liabilities 10,851 11,178 Total liabilities and shareholders' equity 26,428 27.946 Due to IFRIC 23 adoption, non-current tax liabilities are now shown as a separate caption on the balance sheet. For more details refer to the Significant accounting policies, starting on page 94 M N Amounts may not add up due to rounding