Question
In paper manufacturing, pulp brightness is an important performance characteristic. Customers require maximum pulp brightness with maximum uniformity (minimum variance). The company is testing two
In paper manufacturing, pulp brightness is an important performance characteristic. Customers require maximum pulp brightness with maximum uniformity (minimum variance). The company is testing two bleaching chemicals for effectiveness in achieving a brightness of 90. Assume that the data are normally distributed. (a) State and test the hypothesis that the brightness variances of the two chemicals are equal at ? = 0.05. (b) State and test the hypothesis that the brightness means for the two chemicals are equal at ? = 0.05. (c) Which chemical best fulfills the requirements of maximum brightness at minimum variance?
Using Minitab
Chemical 1 Chemical 2 90.61 89.17 90.11 85.73 89.41 93.27 90.69 88.29 89.42 95.16 88.42 87.02 90.40 89.59 90.71 87.31 89.52 87.92 89.25 96.86


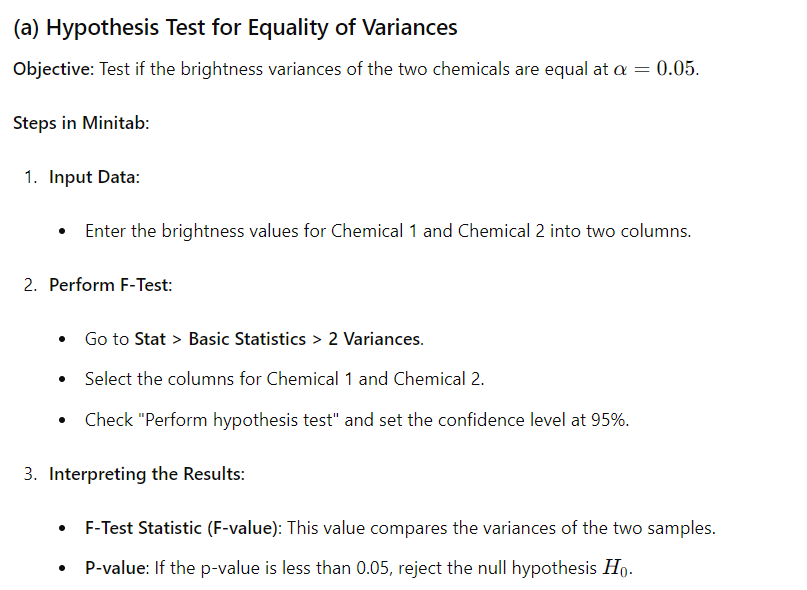
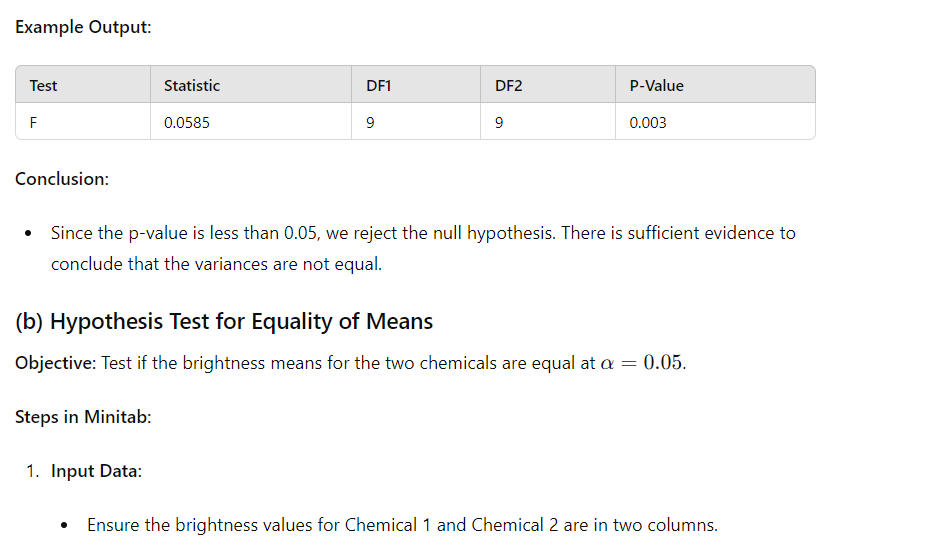
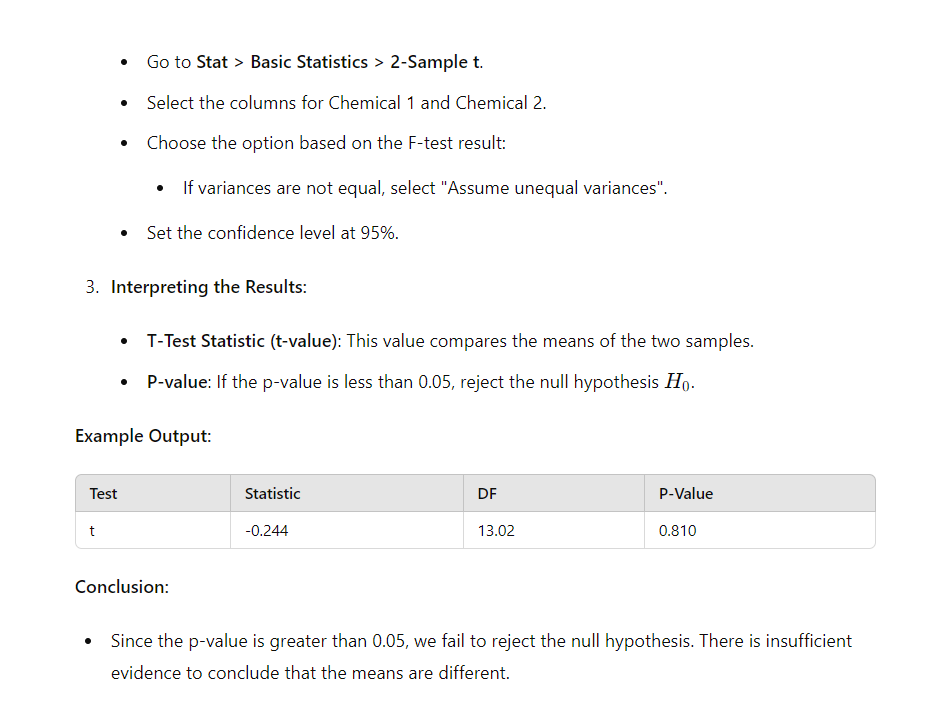
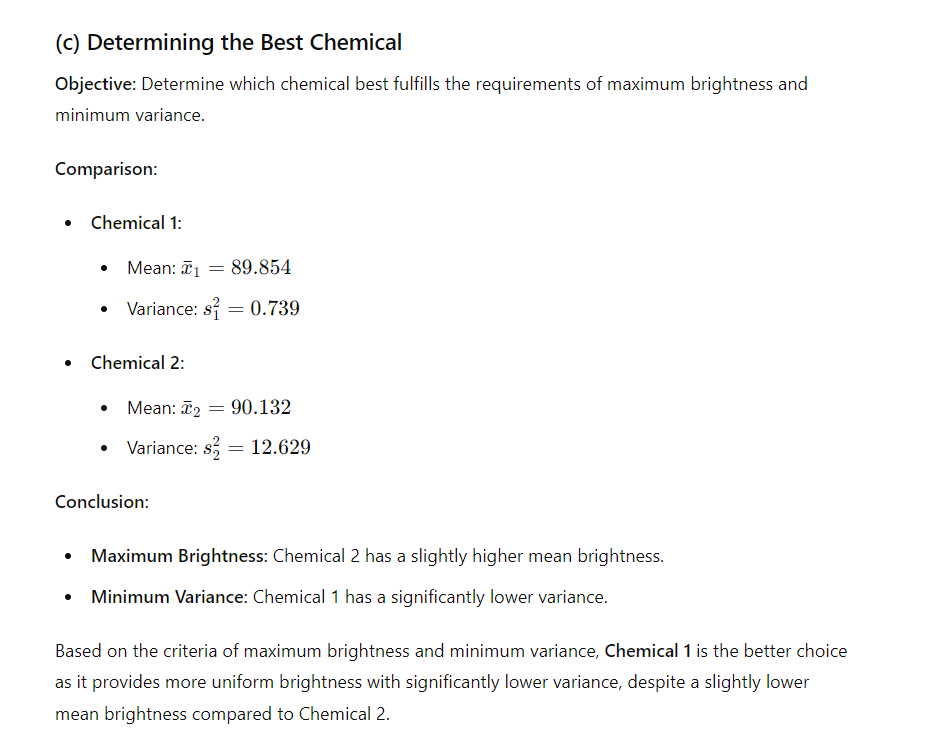
 (a) Hypothesis Test for Equality of Variances Objective: Test if the brightness variances of the two chemicals are equal at a = 0.05. Steps in Minitab: 1. Input Data: Enter the brightness values for Chemical 1 and Chemical 2 into two columns. 2. Perform F-Test: s (5o to Stat > Basic Statistics > 2 Variances. o Select the columns for Chemical 1 and Chemical 2. Check "Perform hypothesis test" and set the confidence level at 95%. 3. Interpreting the Results: F-Test Statistic (F-value): This value compares the variances of the two samples. * P-value: If the p-value is less than 0.05, reject the null hypothesis Hj,. Example Output: Test Statistic DF1 DF2 P-Value F 0.0585 G g 0.003 Conclusion: * Since the p-value is less than 0.05, we reject the null hypothesis. There is sufficient evidence to conclude that the variances are not equal. (b) Hypothesis Test for Equality of Means Objective: Test if the brightness means for the two chemicals are equal at a = 0.05. Steps in Minitab: 1. Input Data: Ensure the brightness values for Chemical 1 and Chemical 2 are in two columns. * (o to Stat > Basic Statistics > 2-Sample t. e Select the columns for Chemical 1 and Chemical 2. Choose the option based on the F-test result: |f variances are not equal, select "Assume unequal variances". e Set the confidence level at 95%. 3. Interpreting the Results: * T-Test Statistic (t-value): This value compares the means of the two samples. e P-value: If the p-value is less than 0.05, reject the null hypothesis Hj. Example Output: Test Statistic DF P-Value t -0.244 13.02 0.810 Conclusion: Since the p-value is greater than 0.05, we fail to reject the null hypothesis. There is insufficient evidence to conclude that the means are different. (c) Determining the Best Chemical Objective: Determine which chemical best fulfills the requirements of maximum brightness and minimum variance. Comparison: Chemical 1: e Mean: T, = 89.854 Variance: 57 = (.739 Chemical 2: e Mean: T = 90.132 e \\ariance: s% = 12.629 Conclusion: Maximum Brightness: Chemical 2 has a slightly higher mean brightness. Minimum Variance: Chemical 1 has a significantly lower variance. Based on the criteria of maximum brightness and minimum variance, Chemical 1 is the better choice as it provides more uniform brightness with significantly lower variance, despite a slightly lower mean brightness compared to Chemical 2
 Step by Step Solution
There are 3 Steps involved in it
Step: 1

Get Instant Access to Expert-Tailored Solutions
See step-by-step solutions with expert insights and AI powered tools for academic success
Step: 2

Step: 3

Ace Your Homework with AI
Get the answers you need in no time with our AI-driven, step-by-step assistance
Get Started


