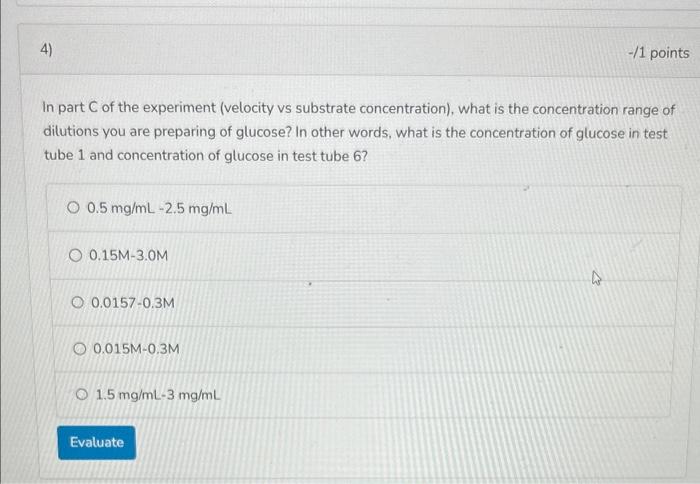
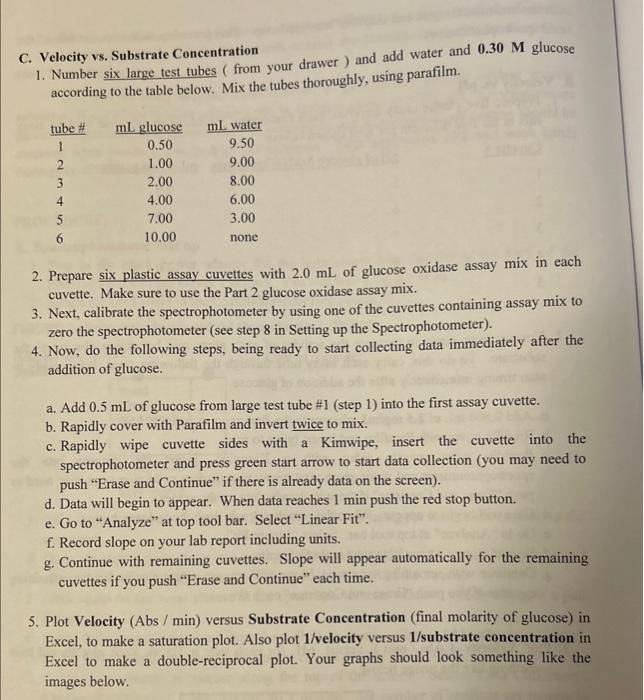
In part C of the experiment (velocity vs substrate concentration), what is the concentration range of dilutions you are preparing of glucose? In other words, what is the concentration of glucose in test tube 1 and concentration of glucose in test tube 6 ? 0.5mg/mL2.5mg/mL 0.15M3.0M 0.01570.3M 0.015M0.3M 1.5mg/mL3mg/mL C. Velocity vs. Substrate Concentration 1. Number six large test tubes (from your drawer) and add water and 0.30M glucose according to the table below. Mix the tubes thoroughly, using parafilm. 2. Prepare six plastic assay cuvettes with 2.0mL of glucose oxidase assay mix in each cuvette. Make sure to use the Part 2 glucose oxidase assay mix. 3. Next, calibrate the spectrophotometer by using one of the cuvettes containing assay mix to zero the spectrophotometer (see step 8 in Setting up the Spectrophotometer). 4. Now, do the following steps, being ready to start collecting data immediately after the addition of glucose. a. Add 0.5mL of glucose from large test tube #1 (step 1) into the first assay cuvette. b. Rapidly cover with Parafilm and invert twice to mix. c. Rapidly wipe cuvette sides with a Kimwipe, insert the cuvette into the spectrophotometer and press green start arrow to start data collection (you may need to push "Erase and Continue" if there is already data on the screen). d. Data will begin to appear. When data reaches 1min push the red stop button. e. Go to "Analyze" at top tool bar. Select "Linear Fit". f. Record slope on your lab report including units. g. Continue with remaining cuvettes. Slope will appear automatically for the remaining cuvettes if you push "Erase and Continue" each time. 5. Plot Velocity (Abs / min) versus Substrate Concentration (final molarity of glucose) in Excel, to make a saturation plot. Also plot 1/velocity versus 1/ substrate concentration in Excel to make a double-reciprocal plot. Your graphs should look something like the images below. In part C of the experiment (velocity vs substrate concentration), what is the concentration range of dilutions you are preparing of glucose? In other words, what is the concentration of glucose in test tube 1 and concentration of glucose in test tube 6 ? 0.5mg/mL2.5mg/mL 0.15M3.0M 0.01570.3M 0.015M0.3M 1.5mg/mL3mg/mL C. Velocity vs. Substrate Concentration 1. Number six large test tubes (from your drawer) and add water and 0.30M glucose according to the table below. Mix the tubes thoroughly, using parafilm. 2. Prepare six plastic assay cuvettes with 2.0mL of glucose oxidase assay mix in each cuvette. Make sure to use the Part 2 glucose oxidase assay mix. 3. Next, calibrate the spectrophotometer by using one of the cuvettes containing assay mix to zero the spectrophotometer (see step 8 in Setting up the Spectrophotometer). 4. Now, do the following steps, being ready to start collecting data immediately after the addition of glucose. a. Add 0.5mL of glucose from large test tube #1 (step 1) into the first assay cuvette. b. Rapidly cover with Parafilm and invert twice to mix. c. Rapidly wipe cuvette sides with a Kimwipe, insert the cuvette into the spectrophotometer and press green start arrow to start data collection (you may need to push "Erase and Continue" if there is already data on the screen). d. Data will begin to appear. When data reaches 1min push the red stop button. e. Go to "Analyze" at top tool bar. Select "Linear Fit". f. Record slope on your lab report including units. g. Continue with remaining cuvettes. Slope will appear automatically for the remaining cuvettes if you push "Erase and Continue" each time. 5. Plot Velocity (Abs / min) versus Substrate Concentration (final molarity of glucose) in Excel, to make a saturation plot. Also plot 1/velocity versus 1/ substrate concentration in Excel to make a double-reciprocal plot. Your graphs should look something like the images below