

Answered step by step
Verified Expert Solution
Question
1 Approved Answer
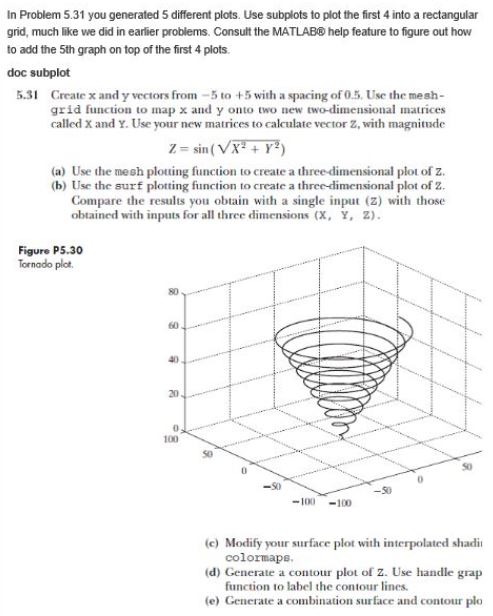
In Problem 5.31 you generated 5 different plots. Use subplots to plot the first 4 into a rectangular grid, much like we did in earlier
Step by Step Solution
There are 3 Steps involved in it
Step: 1

Get Instant Access to Expert-Tailored Solutions
See step-by-step solutions with expert insights and AI powered tools for academic success
Step: 2

Step: 3
Ace Your Homework with AI
Get the answers you need in no time with our AI-driven, step-by-step assistance
Get Started
Database Driven Web Sites
Authors: Mike Morrison, Joline Morrison
1st Edition
061901556X, 978-0619015565