

Question
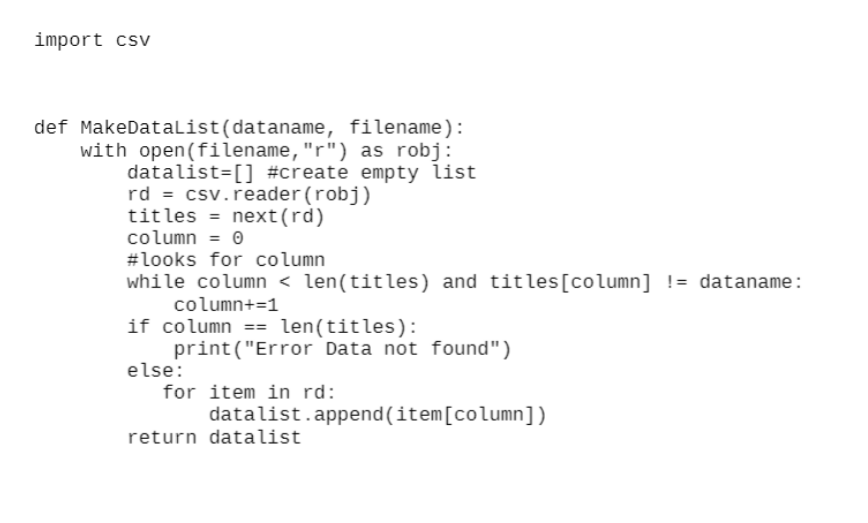
In python from the data, use the function MakeDataList, search for the column mag and store the results into a list. Once you have the
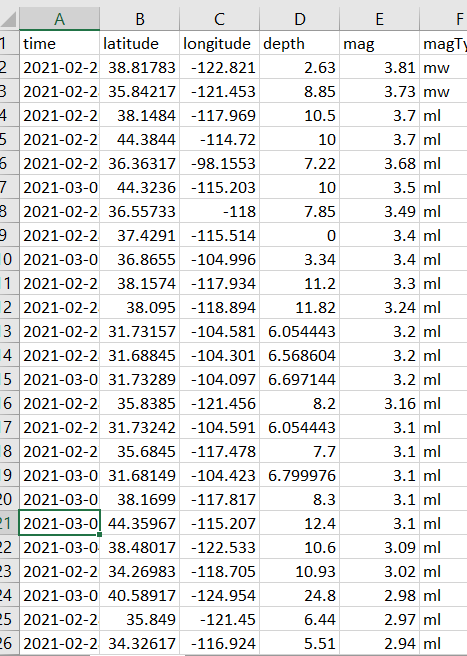
In python from the data, use the function MakeDataList, search for the column "mag" and store the results into a list.
Once you have the data stored into a list, compute the median, mode, and mean. Also, find the max and the min values from the list. 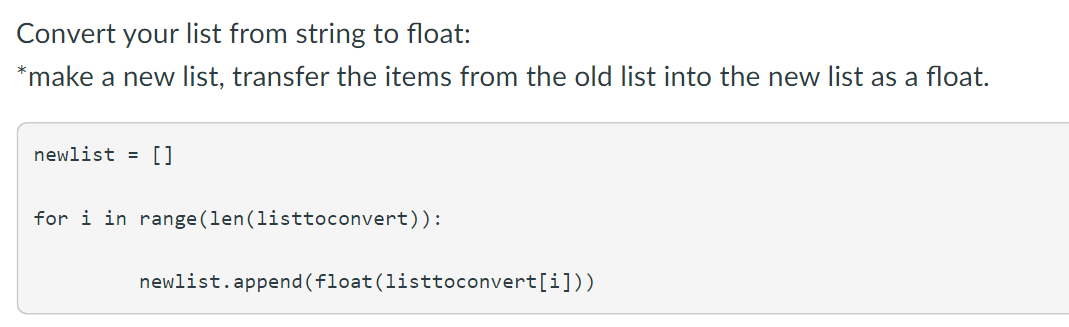
Part 2:
Frequency tables are often created by placing data items in a range. Implement a function that will group earthquake data by the following criteria below and output a frequency table:
lighter(0 - 4.3) light (4.5-4.9)
Moderate (5-5.9)
Major (6-6.9)
Strong(7-7.9)
Part 3:
Output another frequency table that displays the days and the number of earthquakes on that day. Each occurrence of a day represents 1 earthquake. Output a frequency table that shows the day and the number of earthquakes on that day, along with a statement that outputs the day that had the most earthquakes, and the day that had the least.
A B D E F 1 time latitude longitude depth mag magt 2 2021-02-2 38.81783 -122.821 2.63 3.81 mw 3 2021-02-2 35.84217 -121.453 8.85 3.73 mw 4 2021-02-238.1484 -117.969 10.5 3.7 ml 5 2021-02-2 44.3844 -114.72 10 3.7 ml 6 2021-02-2 36.36317 -98.1553 7.22 3.68 ml 7 2021-03-0 44.3236 -115.203 10 3.5 ml 8 2021-02-2 36.55733 -118 7.85 3.49 ml 9 2021-02-2 37.4291 -115.514 0 3.4 ml 0 2021-03-0 36.8655 -104.996 3.34 3.4 ml 1 2021-02-2 38.1574 -117.934 11.2 3.3 ml 2 2021-02-2 38.095 -118.894 11.82 3.24 ml 3 2021-02-2 31.73157 -104.581 6.054443 3.2 ml 4 2021-02-2 31.68845 -104.301 6.568604 3.2 ml 5 2021-03-0 31.73289 -104.097 6.697144 3.2 ml 6 2021-02-2 35.8385 -121.456 8.2 3.16 ml 7 2021-02-2 31.73242 -104.591 6.054443 3.1 ml 8 2021-02-2 35.6845 -117.478 7.7 3.1 ml 9 2021-03-0 31.68149 -104.423 6.799976 3.1 ml 20 2021-03-0 38.1699 117.817 8.3 3.1 ml 1 2021-03-0| 44.35967 -115.207 12.4 3.1 ml 2 2021-03-0 38.48017 -122.533 10.6 3.09 ml 3 2021-02-2 34.26983 -118.705 10.93 3.02 ml 4 2021-03-0 40.58917 -124.954 24.8 2.98 ml 25 2021-02-2 35.849 -121.45 6.44 2.97 ml 6 2021-02-2 34.32617 -116.924 5.51 2.94 ml import csv def MakeDataList(dataname, filename): with open(filename, "r") as robj: datalist=[] #create empty list rd = csv.reader (robj) titles = next(rd) column = 0 #looks for column while columnStep by Step Solution
There are 3 Steps involved in it
Step: 1

Get Instant Access to Expert-Tailored Solutions
See step-by-step solutions with expert insights and AI powered tools for academic success
Step: 2

Step: 3
Ace Your Homework with AI
Get the answers you need in no time with our AI-driven, step-by-step assistance
Get Started
Database Systems Design Implementation And Management
Authors: Peter Robb,Carlos Coronel
5th Edition
061906269X, 9780619062699