

Answered step by step
Verified Expert Solution
Question
1 Approved Answer
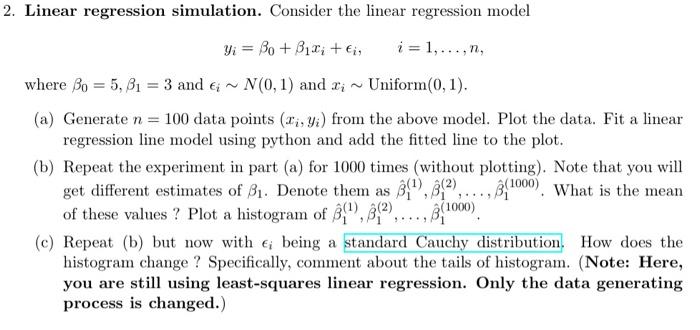
in python Linear regression simulation. Consider the linear regression model yi=0+1xi+i,i=1,,n, where 0=5,1=3 and iN(0,1) and xiUniform(0,1). (a) Generate n=100 data points (xi,yi) from the
in python
Linear regression simulation. Consider the linear regression model yi=0+1xi+i,i=1,,n, where 0=5,1=3 and iN(0,1) and xiUniform(0,1). (a) Generate n=100 data points (xi,yi) from the above model. Plot the data. Fit a linear regression line model using python and add the fitted line to the plot. (b) Repeat the experiment in part (a) for 1000 times (without plotting). Note that you will get different estimates of 1. Denote them as ^1(1),^1(2),,^1(1000). What is the mean of these values ? Plot a histogram of ^1(1),^1(2),,^1(1000). (c) Repeat (b) but now with i being a standard Cauchy distribution. How does the histogram change ? Specifically, comment about the tails of histogram. (Note: Here, you are still using least-squares linear regression. Only the data generating process is changed.) Step by Step Solution
There are 3 Steps involved in it
Step: 1

Get Instant Access to Expert-Tailored Solutions
See step-by-step solutions with expert insights and AI powered tools for academic success
Step: 2

Step: 3
Ace Your Homework with AI
Get the answers you need in no time with our AI-driven, step-by-step assistance
Get Started
T Sql Fundamentals
Authors: Itzik Ben Gan
4th Edition
0138102104, 978-0138102104