

Answered step by step
Verified Expert Solution
Question
1 Approved Answer
In python please IV-111-8139-LEC https://www.eecs.wsu.edu/-shira/cs111/labs/lab11.pdf Task 5: The Logistic Map Function In this task you'll write three functions, one of which will also be used
In python please 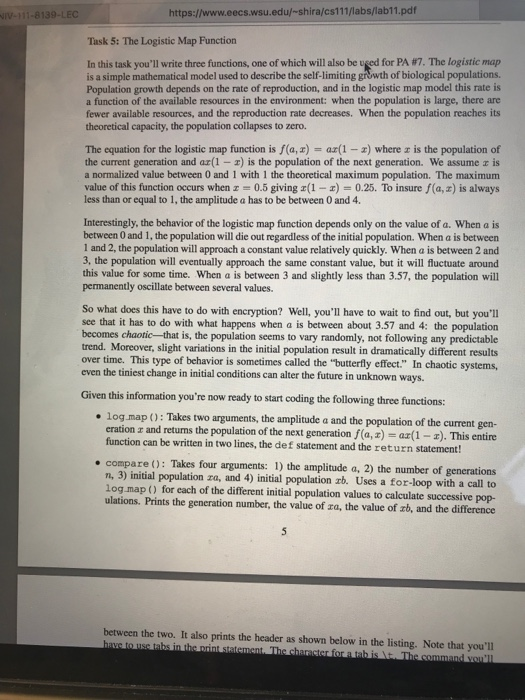
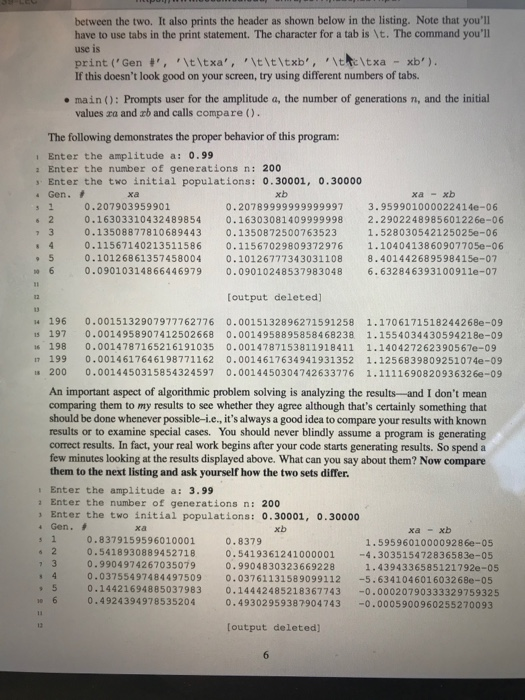
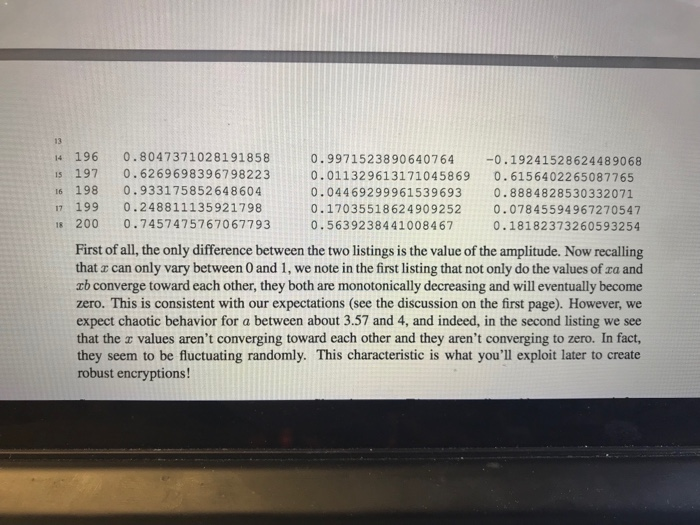
IV-111-8139-LEC https://www.eecs.wsu.edu/-shira/cs111/labs/lab11.pdf Task 5: The Logistic Map Function In this task you'll write three functions, one of which will also be used for PA7, The logistic map is a simple mathematical model used to describe the self-limiting grdwth of biological populations. Population growth depends on the rate of reproduction, and in the logistic map model this rate is a function of the available resources in the environment: when the population is large, there are fewer available resources, and the reproduction rate decreases. When the population reaches its theoretical capacity, the population collapses to zero. The equation for the logistic map function is ra, z) = ar(1-z) where z is the population of the current generation and ar(1 - x) is the population of the next generation. We assume z is a normalized value between 0 and 1 with 1 the theoretical maximum population. The maximum value of this function occurs when z = 0.5 giving z(1-z) = 0.25. To insure f(a,z) is always less than or equal to 1, the amplitude a has to be between 0 and 4 Interestingly, the behavior of the logistic map function depends only on the value of a. When a is between 0 and 1, the population will die out regardless of the initial population. When a is between 1 and 2, the population will approach a constant value relatively quickly. When a is between 2 and 3, the population will eventually approach the same constant value, but it will fluctuate around this value for some time. When a is between 3 and slightly less than 3.57, the population will permanently oscillate between several values. So what does this have to do with encryption? Well, you'll have to wait to find out, but you'l see that it has to do with what happens when a is between about 3.57 and 4: the population becomes chaotic -that is, the population seems to vary randomly, not following any predictable trend. Moreover, slight variations in the initial population result in dramatically different results over time. This type of behavior is sometimes called the "butterfly effect." In chaotic systems, even the tiniest change in initial conditions can alter the future in unknown ways Given this information you 're now ready to start coding the following three functions: . log.map: Takes two arguments, the amplitude a and the population of the current gen- eration r and returns the population of the next generation f(a, z) - a(1 ). This entire function can be written in two lines, the def statement and the return statement! e compare (): Takes four arguments: 1) the amplitude a, 2) the number of generations n, 3) initial population ra, and 4) initial population rb. Uses a for-loop with a call to log map () for each of the different initial population values to calculate successive pop- ulations. Prints the generation number, the value of ra, the value of rb, and the difference between the two. It also prints the header as shown below in the listing. Note that you'll IV-111-8139-LEC https://www.eecs.wsu.edu/-shira/cs111/labs/lab11.pdf Task 5: The Logistic Map Function In this task you'll write three functions, one of which will also be used for PA7, The logistic map is a simple mathematical model used to describe the self-limiting grdwth of biological populations. Population growth depends on the rate of reproduction, and in the logistic map model this rate is a function of the available resources in the environment: when the population is large, there are fewer available resources, and the reproduction rate decreases. When the population reaches its theoretical capacity, the population collapses to zero. The equation for the logistic map function is ra, z) = ar(1-z) where z is the population of the current generation and ar(1 - x) is the population of the next generation. We assume z is a normalized value between 0 and 1 with 1 the theoretical maximum population. The maximum value of this function occurs when z = 0.5 giving z(1-z) = 0.25. To insure f(a,z) is always less than or equal to 1, the amplitude a has to be between 0 and 4 Interestingly, the behavior of the logistic map function depends only on the value of a. When a is between 0 and 1, the population will die out regardless of the initial population. When a is between 1 and 2, the population will approach a constant value relatively quickly. When a is between 2 and 3, the population will eventually approach the same constant value, but it will fluctuate around this value for some time. When a is between 3 and slightly less than 3.57, the population will permanently oscillate between several values. So what does this have to do with encryption? Well, you'll have to wait to find out, but you'l see that it has to do with what happens when a is between about 3.57 and 4: the population becomes chaotic -that is, the population seems to vary randomly, not following any predictable trend. Moreover, slight variations in the initial population result in dramatically different results over time. This type of behavior is sometimes called the "butterfly effect." In chaotic systems, even the tiniest change in initial conditions can alter the future in unknown ways Given this information you 're now ready to start coding the following three functions: . log.map: Takes two arguments, the amplitude a and the population of the current gen- eration r and returns the population of the next generation f(a, z) - a(1 ). This entire function can be written in two lines, the def statement and the return statement! e compare (): Takes four arguments: 1) the amplitude a, 2) the number of generations n, 3) initial population ra, and 4) initial population rb. Uses a for-loop with a call to log map () for each of the different initial population values to calculate successive pop- ulations. Prints the generation number, the value of ra, the value of rb, and the difference between the two. It also prints the header as shown below in the listing. Note that you'll Step by Step Solution
There are 3 Steps involved in it
Step: 1

Get Instant Access to Expert-Tailored Solutions
See step-by-step solutions with expert insights and AI powered tools for academic success
Step: 2

Step: 3
Ace Your Homework with AI
Get the answers you need in no time with our AI-driven, step-by-step assistance
Get Started
SQL Server Database Programming With Visual Basic.NET Concepts Designs And Implementations
Authors: Ying Bai
1st Edition
1119608503, 978-1119608509