

Answered step by step
Verified Expert Solution
Question
1 Approved Answer
in python please! Note on lab submission: You will be testing your code in another environment and then submitting a file (main py) of this
in python please! 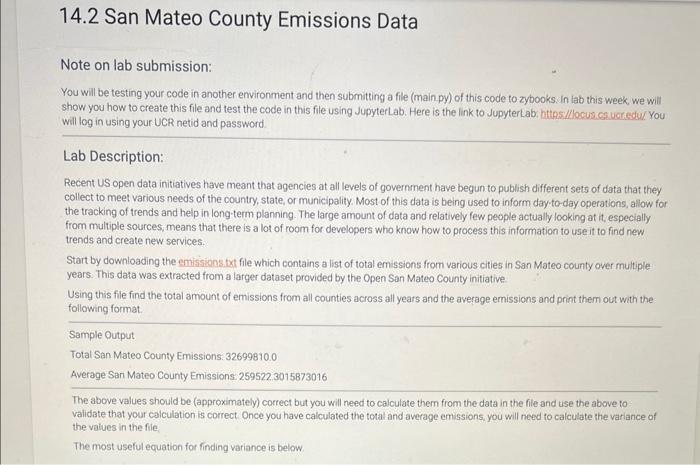
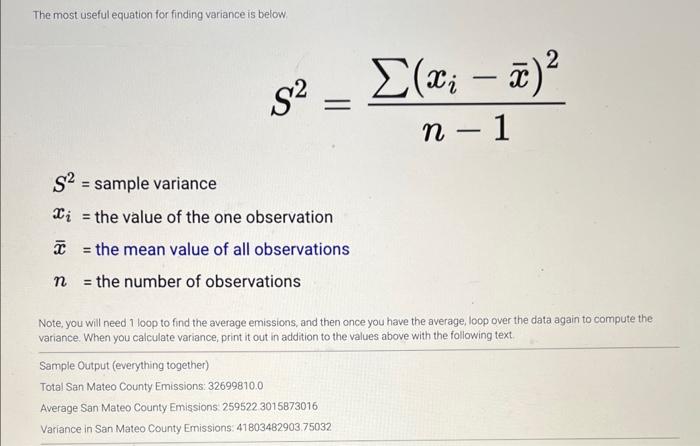
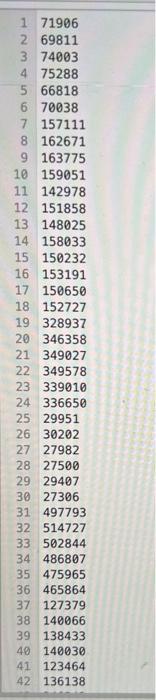
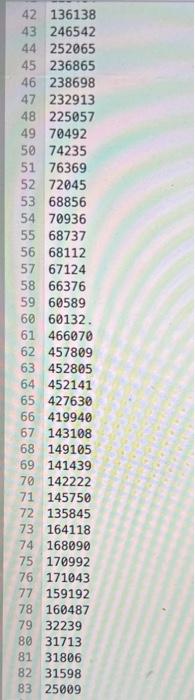
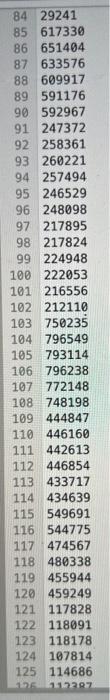
Note on lab submission: You will be testing your code in another environment and then submitting a file (main py) of this code to zybooks in lab this week, we will show you how to create this file and test the code in this file using JupyterLab. Here is the link to JupyterLab: https //locus. ca ucredus You will log in using your UCR netid and password. Lab Description: Recent US open data initiatives have meant that agencies at all levels of government have begun to publish different sets of data that they collect to meet various needs of the country, state, or municipality. Most of this data is being used to inform day-to-day operations, alow for the tracking of trends and help in long-term planning. The large amount of data and relatively few people actually looking at it, especially from multiple sources, means that there is a lot of room for developers who know how to process this information to use it to find new trends and create new services. Start by downloading the emissions.txt file which contains a list of total emissions from various cities in San Mateo county over multiple years. This data was extracted from a larger dataset provided by the Open San Mateo County initiative Using this file find the total amount of emissions from all counties across all years and the average emissions and print them out with the following format. Sample Output Total San Mateo County Emissions: 32699810.0 Average San Mateo County Emissions: 259522,3015873016 The above values should be (approximately) cocrect but you will need to calculate them from the data in the file and use the above to validate that your calculation is correct. Once you have calculated the total and average emissions, you will need to calculate the variance of the values in the file, The most useful equation for finding variance is below. The most useful equation for finding variance is below. S2=n1(xix)2 S2= sample variance xi= the value of the one observation x= the mean value of all observations n = the number of observations Note, you will need 1 loop to find the average emissions, and then once you have the average, loop over the data again to compute the variance. When you calculate variance, print it out in addition to the values above with the following text. Sample Output (everything together) Total San Mateo County Emissions: 32699810.0 Average San Mateo County Emissions 2595223015873016 Variance in San Mateo County Emissions: 41803482903.75032 \begin{tabular}{|l|l} 1 & 71906 \\ 2 & 69811 \\ 3 & 74003 \\ 4 & 75288 \\ \hline 5 & 66818 \\ 6 & 70038 \\ 7 & 157111 \\ 8 & 162671 \\ 9 & 163775 \\ 10 & 159051 \\ 11 & 142978 \\ 12 & 151858 \\ 13 & 148025 \\ 14 & 158033 \\ 15 & 150232 \\ 16 & 153191 \\ 17 & 150650 \\ 18 & 152727 \\ 19 & 328937 \\ 20 & 346358 \\ 21 & 349027 \\ 22 & 349578 \\ \hline 23 & 339010 \\ 24 & 336650 \\ 25 & 29951 \\ 26 & 30202 \\ 27 & 27982 \\ 28 & 27500 \\ 29 & 29407 \\ 30 & 27306 \\ 31 & 497793 \\ 32 & 514727 \\ 33 & 502844 \\ 34 & 138 \\ \hline 3 & 1386036 \\ 35 & 4756 \\ 36 & 465864 \\ 37 & 127379 \\ \hline 136 \\ \hline \end{tabular} \begin{tabular}{ll} 42 & 136138 \\ 43 & 246542 \\ 44 & 252065 \\ 45 & 236865 \\ 46 & 238698 \\ 47 & 232913 \\ 48 & 225057 \\ 49 & 70492 \\ 50 & 74235 \\ 51 & 76369 \\ 52 & 72045 \\ 53 & 68856 \\ 54 & 70936 \\ 55 & 68737 \\ 56 & 68112 \\ 57 & 67124 \\ 58 & 66376 \\ 59 & 60589 \\ 60 & 60132 \\ 61 & 466070 \\ 62 & 457809 \\ 63 & 452805 \\ 64 & 452141 \\ 65 & 427630 \\ 79 & 32239 \\ 81 & 31713 \\ 83 & 31596 \\ 66 & 25009 \\ 67 & 143108 \\ 68 & 149105 \\ 69 & 141439 \\ 70 & 142222 \\ 71 & 145750 \\ 72 & 135845 \\ 73 & 164118 \\ 74 & 168090 \\ 75 & 170992 \\ 76 & 171043 \\ 77 & 159192 \\ \hline 160487 \\ \hline \end{tabular} Step by Step Solution
There are 3 Steps involved in it
Step: 1

Get Instant Access to Expert-Tailored Solutions
See step-by-step solutions with expert insights and AI powered tools for academic success
Step: 2

Step: 3
Ace Your Homework with AI
Get the answers you need in no time with our AI-driven, step-by-step assistance
Get Started
Seven Databases In Seven Weeks A Guide To Modern Databases And The NoSQL Movement
Authors: Luc Perkins, Eric Redmond, Jim Wilson
2nd Edition
1680502530, 978-1680502534