

Answered step by step
Verified Expert Solution
Question
1 Approved Answer
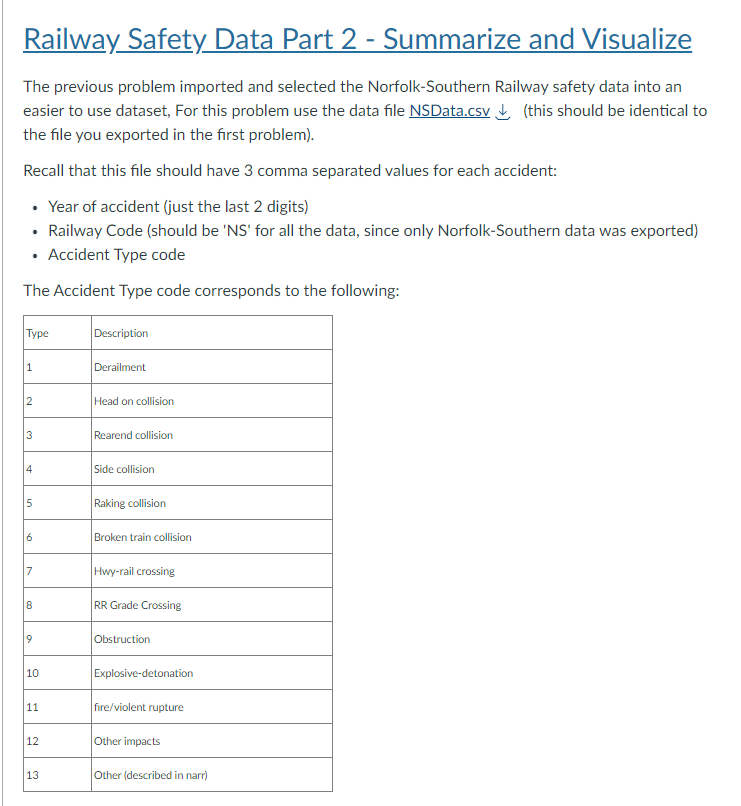
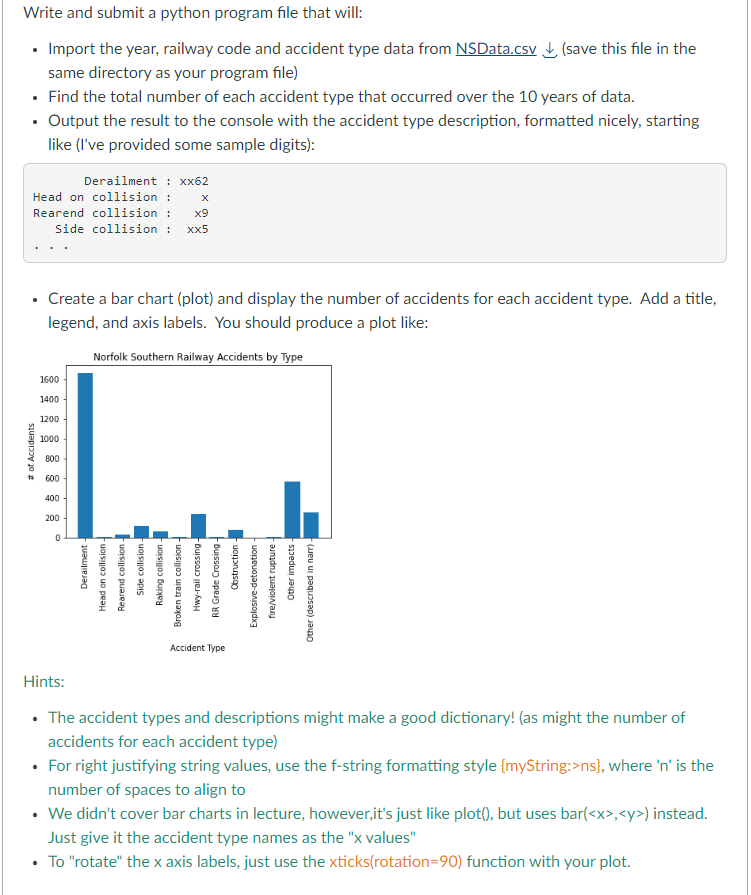
In PYTHON Railway Safety Data Part 2 - Summarize and Visualize The previous problem imported and selected the Norfolk-Southern Railway safety data into an easier
In PYTHON
Step by Step Solution
There are 3 Steps involved in it
Step: 1

Get Instant Access to Expert-Tailored Solutions
See step-by-step solutions with expert insights and AI powered tools for academic success
Step: 2

Step: 3
Ace Your Homework with AI
Get the answers you need in no time with our AI-driven, step-by-step assistance
Get Started
Modern Database Management
Authors: Heikki Topi, Jeffrey A Hoffer, Ramesh Venkataraman
13th Edition
0134773659, 978-0134773650