

Answered step by step
Verified Expert Solution
Question
1 Approved Answer
In Python Using Seaborn library to load data from the excel file into data frame to reproduce the below image Date 1 Mo 2 Mo
In Python Using Seaborn library to load data from the excel file into data frame to reproduce the below image
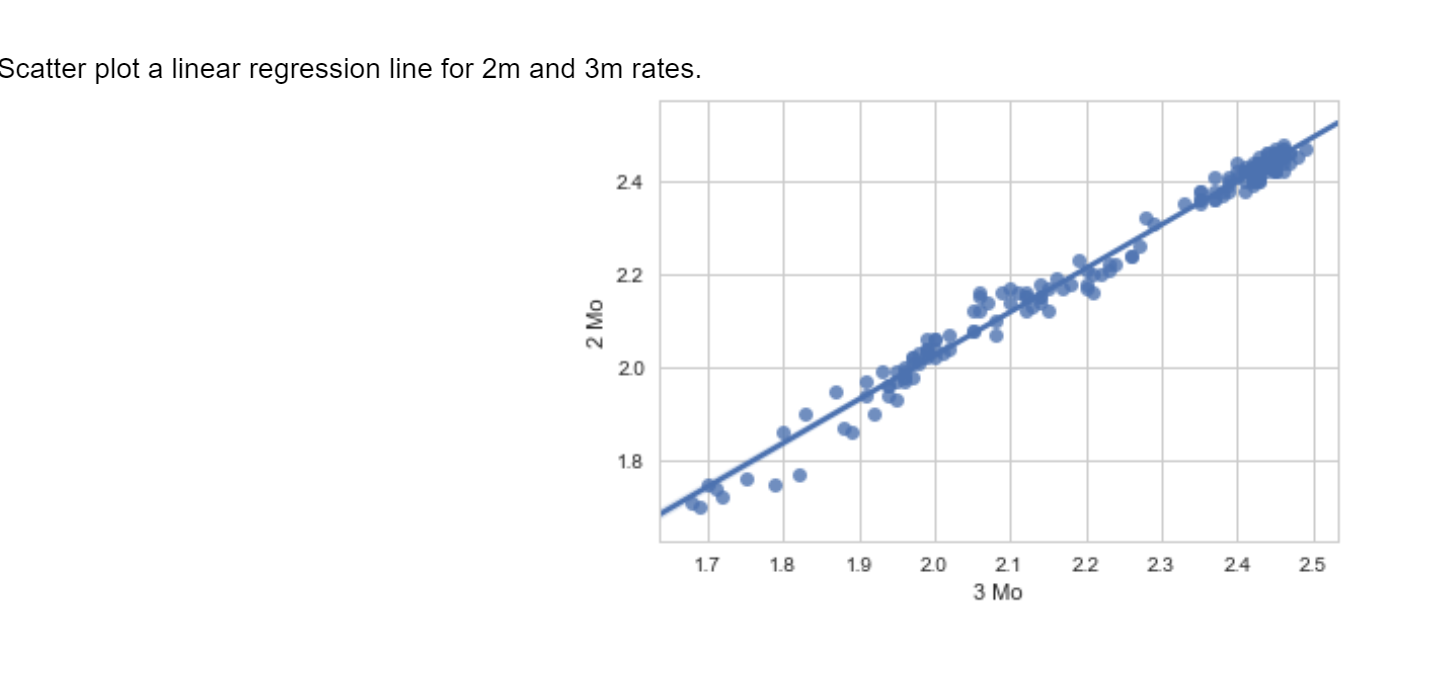
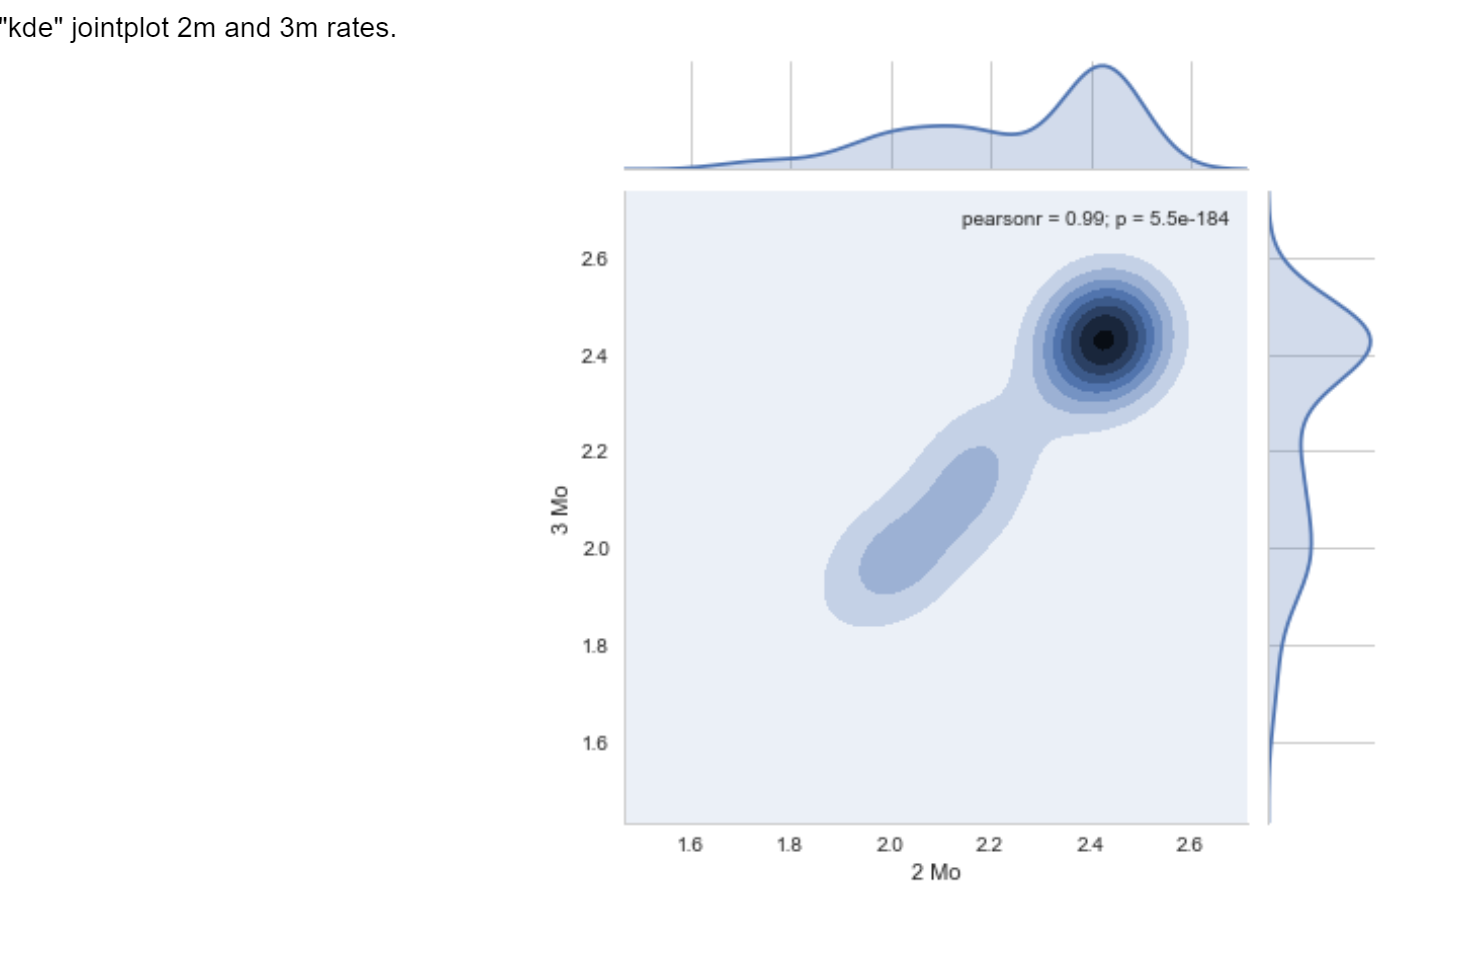
| Date | 1 Mo | 2 Mo | 3 Mo | 6 Mo | 1 Yr | 2 Yr | 3 Yr | 5 Yr | 7 Yr | 10 Yr | 20 Yr | 30 Yr |
|---|---|---|---|---|---|---|---|---|---|---|---|---|
| 01/02/19 | 2.40 | 2.40 | 2.42 | 2.51 | 2.60 | 2.50 | 2.47 | 2.49 | 2.56 | 2.66 | 2.83 | 2.97 |
| 01/03/19 | 2.42 | 2.42 | 2.41 | 2.47 | 2.50 | 2.39 | 2.35 | 2.37 | 2.44 | 2.56 | 2.75 | 2.92 |
| 01/04/19 | 2.40 | 2.42 | 2.42 | 2.51 | 2.57 | 2.50 | 2.47 | 2.49 | 2.56 | 2.67 | 2.83 | 2.98 |
| 01/07/19 | 2.42 | 2.42 | 2.45 | 2.54 | 2.58 | 2.53 | 2.51 | 2.53 | 2.60 | 2.70 | 2.86 | 2.99 |
| 01/08/19 | 2.40 | 2.42 | 2.46 | 2.54 | 2.60 | 2.58 | 2.57 | 2.58 | 2.63 | 2.73 | 2.88 | 3.00 |
| 01/09/19 | 2.40 | 2.42 | 2.45 | 2.52 | 2.59 | 2.56 | 2.54 | 2.57 | 2.64 | 2.74 | 2.90 | 3.03 |
| 01/10/19 | 2.42 | 2.42 | 2.43 | 2.51 | 2.59 | 2.56 | 2.54 | 2.56 | 2.63 | 2.74 | 2.92 | 3.06 |
| 01/11/19 | 2.41 | 2.43 | 2.43 | 2.50 | 2.58 | 2.55 | 2.51 | 2.52 | 2.60 | 2.71 | 2.90 | 3.04 |
| 01/14/19 | 2.42 | 2.43 | 2.45 | 2.52 | 2.57 | 2.53 | 2.51 | 2.53 | 2.60 | 2.71 | 2.91 | 3.06 |
| 01/15/19 | 2.41 | 2.43 | 2.45 | 2.52 | 2.57 | 2.53 | 2.51 | 2.53 | 2.61 | 2.72 | 2.92 | 3.08 |
| 01/16/19 | 2.41 | 2.40 | 2.43 | 2.49 | 2.57 | 2.55 | 2.53 | 2.54 | 2.62 | 2.73 | 2.92 | 3.07 |
| 01/17/19 | 2.41 | 2.41 | 2.42 | 2.50 | 2.57 | 2.56 | 2.55 | 2.58 | 2.66 | 2.75 | 2.93 | 3.07 |
| 01/18/19 | 2.40 | 2.40 | 2.41 | 2.50 | 2.60 | 2.62 | 2.60 | 2.62 | 2.70 | 2.79 | 2.95 | 3.09 |
| 01/22/19 | 2.38 | 2.40 | 2.43 | 2.51 | 2.59 | 2.58 | 2.55 | 2.57 | 2.65 | 2.74 | 2.91 | 3.06 |
| 01/23/19 | 2.37 | 2.38 | 2.41 | 2.51 | 2.59 | 2.58 | 2.57 | 2.59 | 2.66 | 2.76 | 2.93 | 3.07 |
| 01/24/19 | 2.38 | 2.41 | 2.37 | 2.50 | 2.58 | 2.56 | 2.54 | 2.55 | 2.62 | 2.72 | 2.89 | 3.04 |
| 01/25/19 | 2.36 | 2.41 | 2.39 | 2.51 | 2.60 | 2.60 | 2.58 | 2.59 | 2.66 | 2.76 | 2.92 | 3.06 |
| 01/28/19 | 2.39 | 2.41 | 2.42 | 2.51 | 2.60 | 2.60 | 2.58 | 2.58 | 2.65 | 2.75 | 2.92 | 3.06 |
| 01/29/19 | 2.39 | 2.41 | 2.42 | 2.51 | 2.60 | 2.56 | 2.54 | 2.55 | 2.61 | 2.72 | 2.90 | 3.04 |
| 01/30/19 | 2.40 | 2.39 | 2.42 | 2.50 | 2.57 | 2.52 | 2.49 | 2.49 | 2.58 | 2.70 | 2.90 | 3.06 |
| 01/31/19 | 2.42 | 2.43 | 2.41 | 2.46 | 2.55 | 2.45 | 2.43 | 2.43 | 2.51 | 2.63 | 2.83 | 2.99 |
| 02/01/19 | 2.41 | 2.42 | 2.40 | 2.46 | 2.56 | 2.52 | 2.50 | 2.51 | 2.59 | 2.70 | 2.88 | 3.03 |
| 02/04/19 | 2.41 | 2.41 | 2.42 | 2.49 | 2.57 | 2.53 | 2.52 | 2.53 | 2.62 | 2.73 | 2.92 | 3.06 |
| 02/05/19 | 2.39 | 2.40 | 2.42 | 2.50 | 2.56 | 2.53 | 2.50 | 2.51 | 2.60 | 2.71 | 2.89 | 3.03 |
| 02/06/19 | 2.40 | 2.41 | 2.42 | 2.50 | 2.56 | 2.52 | 2.50 | 2.50 | 2.59 | 2.70 | 2.88 | 3.03 |
| 02/07/19 | 2.43 | 2.43 | 2.42 | 2.49 | 2.55 | 2.48 | 2.46 | 2.46 | 2.54 | 2.65 | 2.85 | 3.00 |
| 02/08/19 | 2.43 | 2.43 | 2.43 | 2.49 | 2.54 | 2.45 | 2.43 | 2.44 | 2.53 | 2.63 | 2.82 | 2.97 |
| 02/11/19 | 2.44 | 2.44 | 2.45 | 2.51 | 2.55 | 2.48 | 2.47 | 2.47 | 2.56 | 2.65 | 2.85 | 3.00 |
| 02/12/19 | 2.42 | 2.43 | 2.43 | 2.50 | 2.55 | 2.50 | 2.48 | 2.49 | 2.58 | 2.68 | 2.87 | 3.02 |
| 02/13/19 | 2.42 | 2.42 | 2.44 | 2.51 | 2.55 | 2.53 | 2.52 | 2.53 | 2.61 | 2.71 | 2.89 | 3.04 |
| 02/14/19 | 2.45 | 2.43 | 2.43 | 2.51 | 2.53 | 2.50 | 2.48 | 2.48 | 2.56 | 2.66 | 2.85 | 3.01 |
| 02/15/19 | 2.43 | 2.43 | 2.43 | 2.50 | 2.55 | 2.52 | 2.50 | 2.49 | 2.57 | 2.66 | 2.84 | 3.00 |
| 02/19/19 | 2.44 | 2.42 | 2.45 | 2.52 | 2.54 | 2.50 | 2.47 | 2.47 | 2.55 | 2.65 | 2.84 | 2.99 |
| 02/20/19 | 2.41 | 2.42 | 2.45 | 2.51 | 2.54 | 2.50 | 2.47 | 2.47 | 2.55 | 2.65 | 2.84 | 3.00 |
| 02/21/19 | 2.43 | 2.44 | 2.45 | 2.51 | 2.55 | 2.53 | 2.49 | 2.51 | 2.59 | 2.69 | 2.89 | 3.05 |
| 02/22/19 | 2.43 | 2.45 | 2.46 | 2.51 | 2.55 | 2.48 | 2.46 | 2.47 | 2.55 | 2.65 | 2.86 | 3.02 |
| 02/25/19 | 2.44 | 2.46 | 2.47 | 2.51 | 2.56 | 2.51 | 2.48 | 2.48 | 2.57 | 2.67 | 2.87 | 3.03 |
| 02/26/19 | 2.43 | 2.44 | 2.45 | 2.51 | 2.55 | 2.48 | 2.44 | 2.45 | 2.54 | 2.64 | 2.84 | 3.01 |
| 02/27/19 | 2.43 | 2.44 | 2.45 | 2.52 | 2.54 | 2.50 | 2.48 | 2.49 | 2.59 | 2.69 | 2.91 | 3.07 |
Step by Step Solution
There are 3 Steps involved in it
Step: 1

Get Instant Access to Expert-Tailored Solutions
See step-by-step solutions with expert insights and AI powered tools for academic success
Step: 2

Step: 3
Ace Your Homework with AI
Get the answers you need in no time with our AI-driven, step-by-step assistance
Get Started
SQL Server Database Programming With Visual Basic.NET Concepts Designs And Implementations
Authors: Ying Bai
1st Edition
1119608503, 978-1119608509