

Question
In R, how would you write code for this? I have not added the data file so assuming it has one. So in short it
In R, how would you write code for this? I have not added the data file so assuming it has one.

So in short it deals with twitter and I have to come up with a function that gives such a result.
This is the extent of the question itself. We have a file that has all the data, including posts from Twitter. What I need to find is how do you make a function that will give me the tweet I require. I can not give the data away.
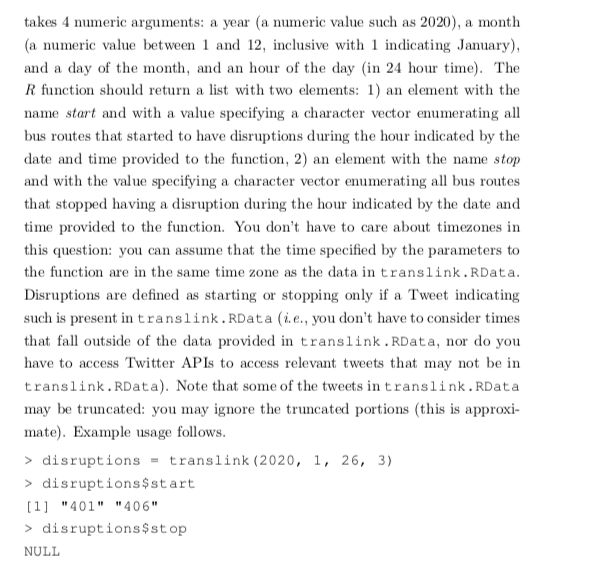
Write an R function named translink that takes 4 numeric arguments: a year (a numeric value such as 2020), a month (a numeric value between 1 and 12, inclusive with 1 indicating January), and a day of the month, and an hour of the day (in 24 hour time). The R function should return a list with two elements: 1) an element with the name start and with a value specifying a character vector enumerating all bus routes that started to have disruptions during the hour indicated by the date and time provided to the function, 2) an element with the name stop and with the value specifying a character vector enumerating all bus routes that stopped having a disruption during the hour indicated by the date and time provided to the function. You don't have to care about timezones in this question: you can assume that the time specified by the parameters to the function are in the same time zone as the data in translink.Data. Disruptions are defined as starting or stopping only if a Tweet indicating such is present in translink. RData (i.e., you don't have to consider times that fall outside of the data provided in translink. RData, nor do you have to access Twitter APIs to access relevant tweets that may not be in translink. RData). Note that some of the tweets in translink. RData may be truncated: you may ignore the truncated portions (this is approxi- mate). Example usage follows. > disruptions - translink (2020, 1, 26, 3) > disruptions $start [1] "401" "406" > disruptions $stop NULL Write an R function named translink that takes 4 numeric arguments: a year (a numeric value such as 2020), a month (a numeric value between 1 and 12, inclusive with 1 indicating January), and a day of the month, and an hour of the day (in 24 hour time). The R function should return a list with two elements: 1) an element with the name start and with a value specifying a character vector enumerating all bus routes that started to have disruptions during the hour indicated by the date and time provided to the function, 2) an element with the name stop and with the value specifying a character vector enumerating all bus routes that stopped having a disruption during the hour indicated by the date and time provided to the function. You don't have to care about timezones in this question: you can assume that the time specified by the parameters to the function are in the same time zone as the data in translink.Data. Disruptions are defined as starting or stopping only if a Tweet indicating such is present in translink. RData (i.e., you don't have to consider times that fall outside of the data provided in translink. RData, nor do you have to access Twitter APIs to access relevant tweets that may not be in translink. RData). Note that some of the tweets in translink. RData may be truncated: you may ignore the truncated portions (this is approxi- mate). Example usage follows. > disruptions - translink (2020, 1, 26, 3) > disruptions $start [1] "401" "406" > disruptions $stop NULLStep by Step Solution
There are 3 Steps involved in it
Step: 1

Get Instant Access to Expert-Tailored Solutions
See step-by-step solutions with expert insights and AI powered tools for academic success
Step: 2

Step: 3
Ace Your Homework with AI
Get the answers you need in no time with our AI-driven, step-by-step assistance
Get Started
Statistical And Scientific Database Management International Working Conference Ssdbm Rome Italy June 21 23 1988 Proceedings Lncs 339
Authors: Maurizio Rafanelli ,John C. Klensin ,Per Svensson
1st Edition
354050575X, 978-3540505754