

Answered step by step
Verified Expert Solution
Question
1 Approved Answer
in R Studio, using the woolridge package, install.packages(woolridge) data('rdchem', package='wooldridge') attach(rdchem) PROBLEM 1: For the population of firms in the chemical industry, let rd denote
in R Studio, using the woolridge package,
install.packages("woolridge")
data('rdchem', package='wooldridge') attach(rdchem)
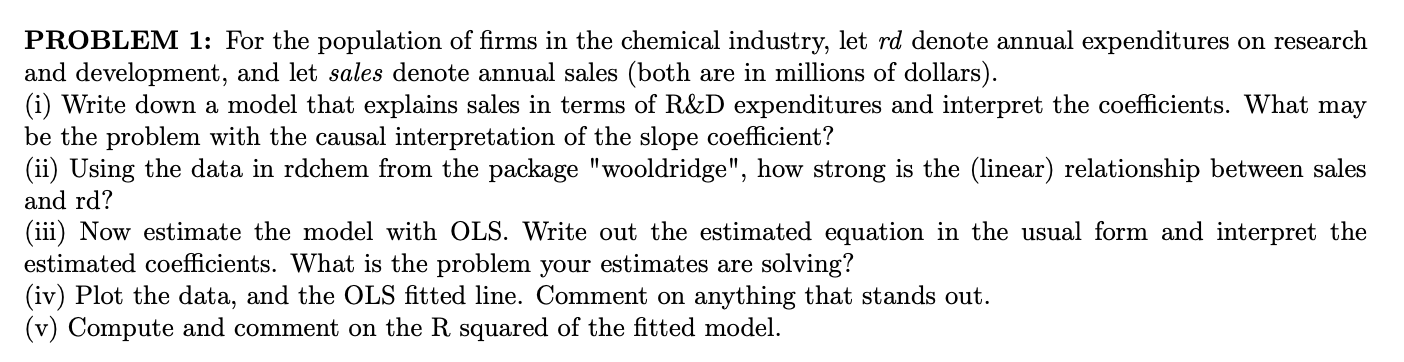
PROBLEM 1: For the population of firms in the chemical industry, let rd denote annual expenditures on research and development, and let sales denote annual sales (both are in millions of dollars). (i) Write down a model that explains sales in terms of R&D expenditures and interpret the coefficients. What may be the problem with the causal interpretation of the slope coefficient? (ii) Using the data in rdchem from the package "wooldridge", how strong is the (linear) relationship between sales and rd? (iii) Now estimate the model with OLS. Write out the estimated equation in the usual form and interpret the estimated coefficients. What is the problem your estimates are solving? (iv) Plot the data, and the OLS fitted line. Comment on anything that stands out. (v) Compute and comment on the R squared of the fitted model. PROBLEM 1: For the population of firms in the chemical industry, let rd denote annual expenditures on research and development, and let sales denote annual sales (both are in millions of dollars). (i) Write down a model that explains sales in terms of R&D expenditures and interpret the coefficients. What may be the problem with the causal interpretation of the slope coefficient? (ii) Using the data in rdchem from the package "wooldridge", how strong is the (linear) relationship between sales and rd? (iii) Now estimate the model with OLS. Write out the estimated equation in the usual form and interpret the estimated coefficients. What is the problem your estimates are solving? (iv) Plot the data, and the OLS fitted line. Comment on anything that stands out. (v) Compute and comment on the R squared of the fitted modelStep by Step Solution
There are 3 Steps involved in it
Step: 1

Get Instant Access to Expert-Tailored Solutions
See step-by-step solutions with expert insights and AI powered tools for academic success
Step: 2

Step: 3
Ace Your Homework with AI
Get the answers you need in no time with our AI-driven, step-by-step assistance
Get Started
OpenStack Trove
Authors: Amrith Kumar, Douglas Shelley
1st Edition
1484212215, 9781484212219