Question
In section 10.7.1 we questioned whether the linear relationship between receipts, price and advertising expenditure is likely to be realistic and suggested instead of a
In section 10.7.1 we questioned whether the linear relationship between receipts, price and advertising expenditure is likely to be realistic and suggested instead of a model that contained the square of advertising expenditure as an additional term. The additional term was designed to capture possible diminishing returns to advertising expenditure. A similar argument can be made with respect to the response of receipts to price changes. Our estimates suggest that the demand is price elastic. Is it reasonable to think that demand will always be price elastic irrespective of the price? That is, as we continually lower the price, will receipts continue to increase? Bay area residents are discerning diners; it is unlikely that they will consume the necessary number of burgers to keep receipts increasing. With these thoughts in mind, consider the alternative statistical model

a. Find the expressions for the response of total receipts to price and the response of total receipts to advertising expenditure. That is find the partial derivatives  and
and 
b. From an economic standpoint, what signs would you expect on each of the coefficients?
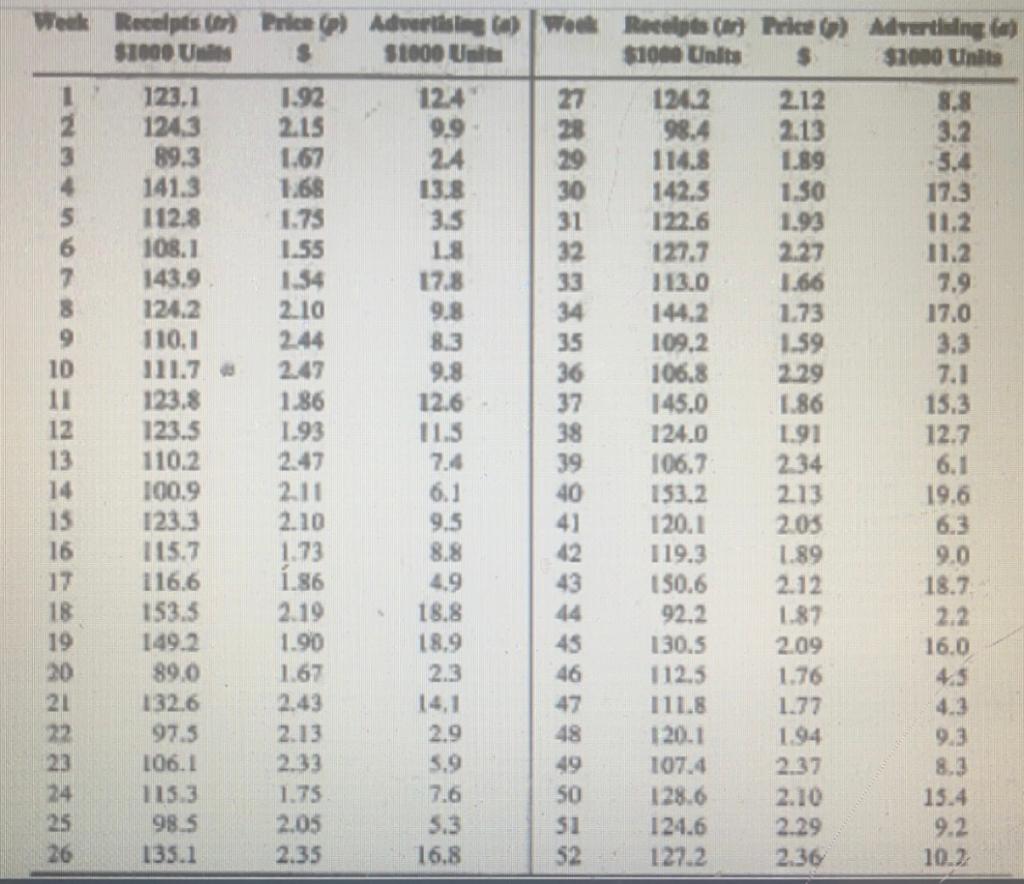
c. Using the 52 observations in Table 9.1, find the least squares estimates of the coefficients and report the estimated equation in the conventional way. Comment on the estimated equation from both an economic and statistical standpoint.
d. Show that the advertising expenditure will be optimal for p=1 and a=40 if  . Test whether this relationship between
  s is compatible with the sample of data.
e. In section 10.8 we investigated an executives claim that  and
and  would yield
  . In the context of the model being considered in this exercise, find the relationship between the
  s that must hold for this claim not to be true. Test the compatibility of this relationship with the sample of data.
f. Perform a joint test of the hypothesis in parts d and e.
g. Test the null hypothesis  . What is the relevance of this hypothesis?
Table 9.1
Step by Step Solution
There are 3 Steps involved in it
Step: 1

Get Instant Access to Expert-Tailored Solutions
See step-by-step solutions with expert insights and AI powered tools for academic success
Step: 2

Step: 3
Ace Your Homework with AI
Get the answers you need in no time with our AI-driven, step-by-step assistance
Get Started