Answered step by step
Verified Expert Solution
Question
1 Approved Answer
In the attached annual report there is a footnote on Pensions and Other Post Retirement Benefits. The assignment is to document what ASC topic reference
In the attached annual report there is a footnote on Pensions and Other Post Retirement Benefits. 
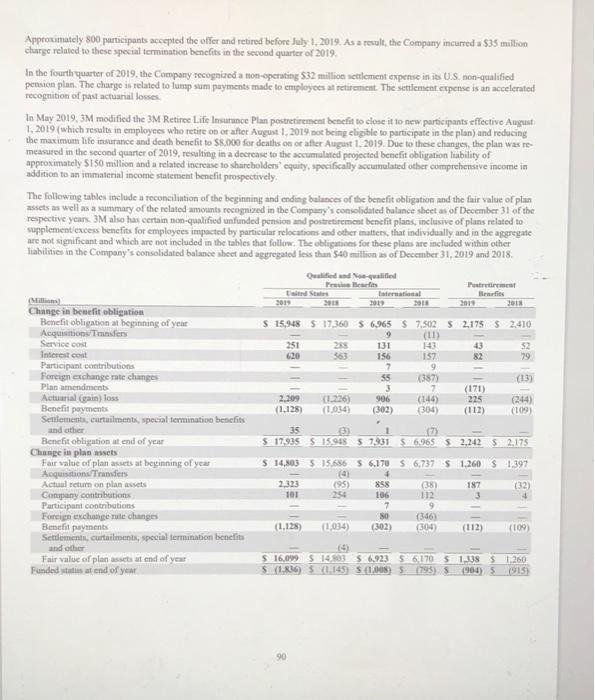
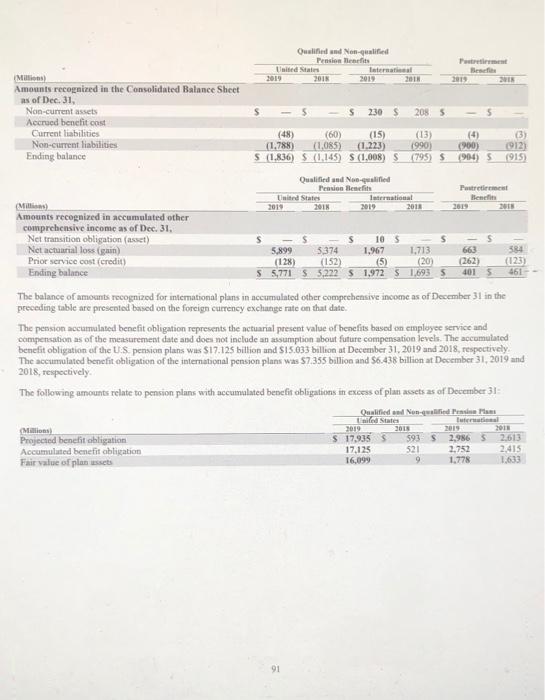
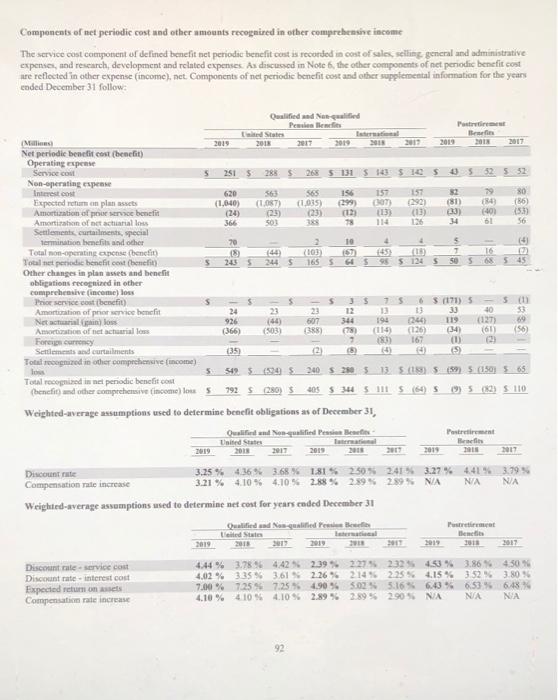
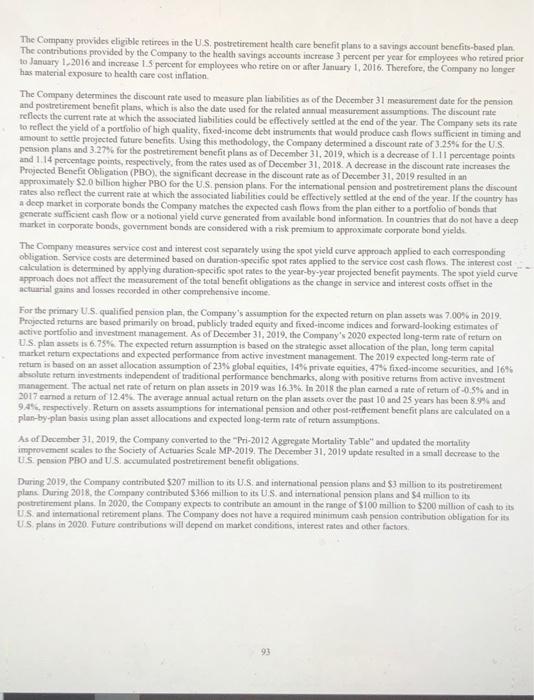
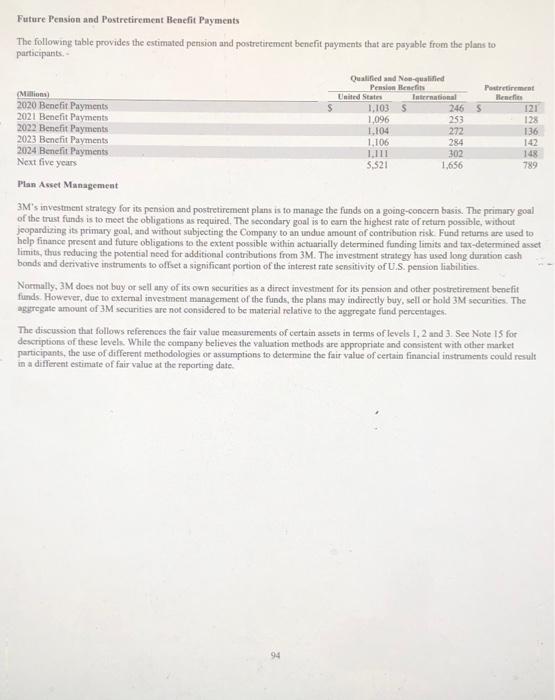
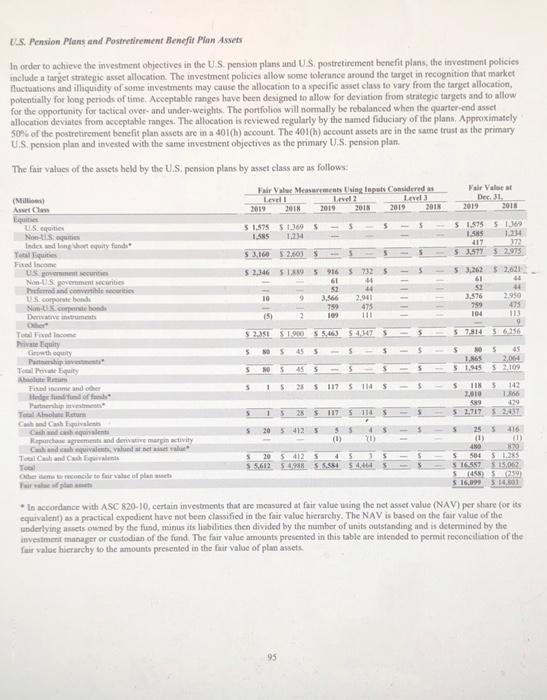
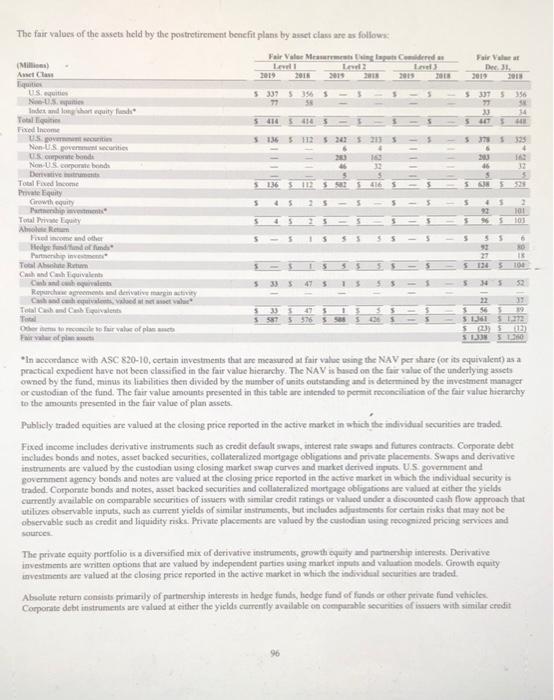
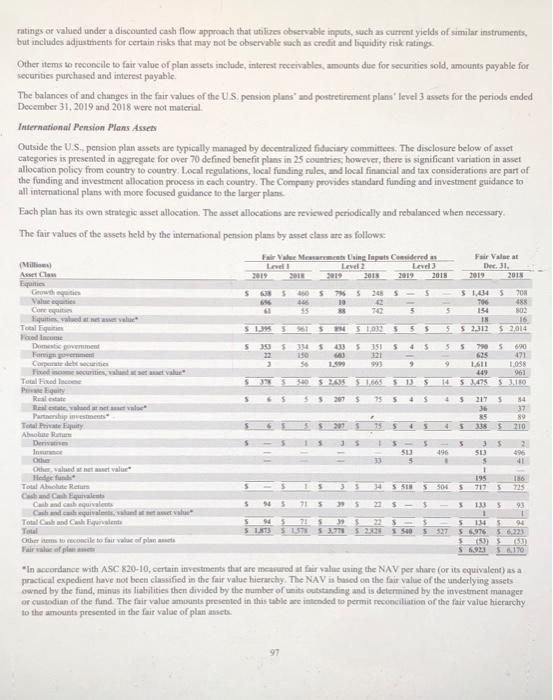
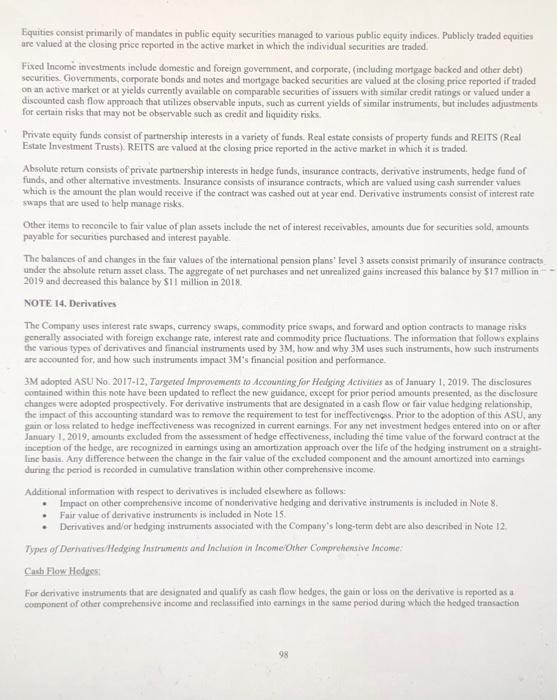
- NOTE 13. Pension and Postretirement Benefit Plans 3M has company-sponsored retirement plans covering substantially all U.S. employees and many employees outside the United States. In total, 3M has over 75 defined benefit plans in 28 countries. Pension benefits associated with these plans generally are based on each participant's years of service, compensation, and age at retirement or termination. The primary U.S. defined benefit pension plan was closed to new participants effective January 1, 2009. The Company also provides certain postretirement health care and life insurance benefits for its U.S. employees who reach retirement age while employed by the Company and were employed by the Company prior to January 1, 2016. Most international employees and retirees are covered by government health care programs. The cost of company provided postretirement health care plans for international employees is not material and is combined with U.S. amounts in the tables that follow The Company has made deposits for its defined benefit plans with independent trustees. Trust funds and deposits with insurance companies are maintained to provide pension benefits to plan participants and their beneficiaries. There are no plan assets in the non- qualified plan due to its nature. For its U.S. postretirement health care and life insurance benefit plans, the Company has set aside amounts at least equal to annual benefit payments with an independent trustee. The Company also sponsors employee savings plans under Section 401(k) of the Internal Revenue Code. These plans are offered to substantially all regular U.S. employees. For eligible employees hired prior to January 1, 2009, employee 401(k) contributions of up to 5% of eligible compensation matched in cash at rates of 45% or 60%, depending on the plan in which the employee participates. Employees hired on or after January 1, 2009, receive a cash match of 100% for employee 401(k) contributions of up to 3% of eligible compensation and receive an employer retirement income account cash contribution of 3% of the participant's total eligible compensation. All contributions are invested in a number of investment funds pursuant to the employees' elections. Employer contributions to the U.S. defined contribution plans were $186 million $173 million and $159 million for 2019, 2018 and 2017, respectively. 3M subsidiaries in various international countries also participate in defined contribution plans. Employer contributions to the international defined contribution plans were $96 million, 599 million and $88 million for 2019, 2018 and 2017, respectively In May 2019 (as part of the 2019 restructuring actions discussed in Note 5), the Company began offering a voluntary early retirement incentive program to certain eligible participants of its U.S. pension plans who meet age and years of pension service requirements. The eligible participants who accepted the offer and retired by July 1, 2019 received an enhanced pension benefit. Pension benefits were enhanced by adding one additional year of pension service and one additional year of age for certain benefit calculations 89 Approximately 800 participants accepted the offer and retired before July 1 2019. As a result, the Company incurred a $35 million charge related to these special termination benefits in the second quarter of 2019, In the fourth quarter of 2019, the Company recognized a non-operating 532 million settlement expense in its U.S. on-qualified pension plan. The charge is related to lump sum payments made to employees at setisement. The settlement expense is an accelerated recognition of past actuarial losses In May 2019, 3M modified the 3M Retiree Life Insurunce Plan postretirement benefit to close it to new participants effective August 1. 2019 (which results in employees who retire on or after August 1, 2019 not being eligible to participate in the plan) and reducing the maximum life insurance and death benefit to SR.000 for deaths on or after August 1. 2019. Due to these changes the plan was re- measured in the second quarter of 2019, resulting in a decrease to the accumulated projected benefit obligation liability of approximately 150 million and a related increase to shareholders equity, specifically accumulated other comprehensive income in addition to an immaterial income statement benefit prospectively, The following tables include a reconciliation of the beginning and ending balances of the benefit obligation and the fair value of plan assets as well as a summary of the related amounts recognized in the Company's consolidated balance sheet as of December 31 of the respective years. 3M also has certain non-qualified unfunded pension and postretirement benefit plans, inclusive of plans related to supplement excess benefits for employees impacted by particular relocations and other matters that individually and in the aggregate are not significant and which are not included in the tables that follow. The obligations for these plans are included within other Tiabilities in the Company's consolidated balance sheet and aggregated less than 540 million as of December 31, 2019 and 2018 Pestre Outtalai Nee potted International 28 2013 2015 2019 2011 2.209 906 Si Change in benefit obligation Benefit obligation at beginning of year Acquisitions Trasfers Service cost Interest cost Participant contributions Foreign exchange rate changes Plan amendments Actuarial (gain) loss Benefit payments Sentiments, curtailmentsspecial termination benefits and other Benefit obligation at end of year Change in plan assets Fair value of plan assets at beginning of yeas Acquisitions Transfers Actual return on planets Company contributions Participant contributions Foreign exchange rate changes Benefit payments Settlement, curtailments, special termination benefits and other Fair value of plan assets at end of year Funded is at end of year $ 15,948 517360 S 6.965 $ 7.502 52.175 52.410 9 (11) 251 25 131 143 43 S2 620 363 156 157 82 79 7 9 55 (387) (13) 3 7 (171) 1.226) (144) 225 (244) (1.128) (302) 304) (112) (109 35 $ 17,935 S 15.96857,931 56.965 52.242 $ 2.175 $ 14,803 5.15686 S 6170 S 6,737 $ 1.260 $ 1.397 (4) 2.323 (95) (38) (32) 101 106 112 3 7 9 80 (346) (1.128) 1.034) (302) (300 (112) (109) 858 187 (4) $ 16,099 S 14801 5.923 561705 1.138 $ 1260 $(1.836) $ (1.145 S (1,008) 5 (795) S (904) 5 (915) Qualified and Non-qualified Pension Menefits Prement United States International MI) Besc 2019 2018 2019 2018 2 Amounts recognized in the Consolidated Balance Sheet as of Dec. 31, Non-current assets s 230 S 2085 Accrued benefit cost Current liabilities (48) (60) (15) (13) (4) 3 Non-current liabilities (1.788) (1.085) (1.223) 1990) (900) 1912) Ending balance S (1.836) S (1.145) S (1,008) S (795) S 1904) 5 (915 Qualified and qualified Pension Benefits Potretirement wid States International Bencin Milli 2019 2018 2019 2018 2018 Amounts recognized in accumulated other comprehensive income as of Dec. 31. Net transition obligation (asset) 10 S Net actuarial loss (ga) 5.899 3,374 1,967 1.713 663 384 Prior service cost (credit) (128) (152) (5) (20) (262) (125) Ending balance 55,771 55,222 S 1,972 S 1.6935 401 461 The balance of amounts recognized for international plants in accumulated other comprehensive income as of December 31 in the preceding table are presented based on the foreign currency exchange rate on that date. The pension accumulated benefit obligation represents the actuarial present value of hencfits based on employee service and compensation as of the measurement date and does not include an assumption about future compensation levels. The accumulated benefit obligation of the U.S. pension plans was $17.125 billion and $15.633 billion at December 31, 2019 and 2018, respectively The accumulated benefit obligation of the international pension plans was $7.355 billion and $6.438 billion at December 31, 2019 and 2018, respectively The following amounts relate to pension plans with accumulated benefit obligations in excess of plan assets as of December 31 Qualified and Non-wed Press Millions 2019 SO 2013 Projected benefit obligation $ 17,9355 593 2,986 2,613 Accumulated benefit obligation 17,125 521 2.752 2.415 Fair value of planets 16.099 9 1.778 1.633 S 91 Components of net periodic cost and other amounts recogmired in other comprehensive income The service cost component of delined benefit net periodse benefit cost is recorded in cost of sales, seiling general and administrative expenses, and research, development and related expenses. As discussed in Note 6, the other components of net periodic benefit cost are reflected in other expense (income), net. Components of net periodic benefit cost and other supplemental information for the years ended December 31 follow > 113) 243 : (126) Qualified and Non-gualified Penslewe Pri (M 2019 2018 2017 3019 2011 2019 2017 Net periodic benefitcost benefit) Operating expense Service con 5 2515 28 $268 5 131 5 143 $ 10 $3552 552 Non-operating espese Interest.com 620 563 565 157 157 82 79 80 Expected the plants (1.040) (1087 (1035) (299) 07 (81) 34 (86) Amortization of preserve benefit (24) (23) (23) (13) 33) (401 15. Amortizon of net actitalls 366 503 114 125 34 56 Settlements, curtaiments, special termination benefits and other 70 2 10 $ 0 Total non-operating expense (benefit (10) 7 16 Totalet periode benefit cost benefit) 5 $ 244 S 1655 5124 S50 5 545 Other changes in plan sues and benefit obligations recognised in other comprehensive income) loss Prior service cost benefit) S s 3 $ 75 6 1171) 5 5 (1) Amortation of pornice benefit 24 23 23 30 33 Net actual) 926 (44) 607 344 194 (24) 119 (127) 69 Amortion of net actuarial loss (366) (503) (388) 78 (114) (34) (61) (56) Foreign currency 7 183) 167 2 Settlements and curtailments (35 15 Total recognized in other comprehensive (income) low 55495.94 $240 S2805 13.5 (59) 5.50 5.65 Toulon nel periodic benefits (hencfind other comprehensive income lo 5 792 S 280) $ 40$ $ 344 55 (64) S (82) 5110 Weighted average assumptions used to determine benefit obligations as of December 31, Qualidad Non-golfindes Poster United States Brin 2019 2018 2019 2019 2017 Discount rate 3.25% 4,36% 3.68% 18152305 245 3.27% 4.41% 3.79% Compensation rate increase 3.21% 4,10 % 4,10% 2.88% 2.89% 2.89% NA NA NA Weighted average assumptions used to determine netcost for years eaded December 31 Chutties and Mentitled treates ited States theme 2019 2018 2011 Discount rate service cost 4.44% 3.785 4.42 2.39% 2.25 2325 453% 3.86% 450 Discount rate interest cost 4,02% 335 % 3.615 2.26 % 214 2255 4.15% 3.52% 3.80 Expected return on 7.00% 7.25 5725 4.9055025 5.165 643 % 6,53% 6,48% Compensation rate increase 4.10 % 4105 4.10% 2.89% 2.89% 2.905 NA NA NA 92 The Company provides eligible retiroes in the US postretirement health care benefit plans to a savings account benefits-based plan. The contributions provided by the Company to the health savings accounts increase percent per year for employees who retired prior to January 1 2016 and increase 15 percent for employees who retire on or after January 1, 2016. Therefore, the Company no longer has material exposure to health care cost inflation The Company determines the discount rate used to measure plan liabilities as of the December 31 measurement date for the pension and postretirement benefit plans, which is also the date used for the related annual measurement assumptions. The discount rate reflects the current rate at which the associated liabilities could be effectively settled at the end of the year. The Company sets its rate to reflect the yield of a portfolio of high quality, fixed-income debt instruments that would produce cash flows sufficient in timing and amount to settle projected future benefits. Using this methodology, the Company determined a discount rate of 3.25% for the US pension plans and 3.27% for the postretirement benefit plans as of December 31, 2019, which is a decrease of 11 percentage points and 114 percentage points, respectively, from the rates used as of December 31, 2018. A decrease in the discount rate increases the Projected Benefit Obligation (PBO), the significant decrease in the discount rate as of December 31, 2019 resulted in an approximately $2.0 billion higher PRO for the US pension plans. For the interational pension and postretirement plans the discount rates also reflect the current rate at which the associated liabilities could be effectively settled at the end of the year. If the country has a deep market in corporate bonds the Company matches the expected cash flows from the plan either to a portfolio of bonds that generate sufficient cash flow or a notional yield eurve generated from available bond information. In countries that do not have a deep market in corporate boods, government bonds are considered with a risk premium to approximate corporate bond yield The Company measures service cost and interest cost separately using the spot yield curve approach applied to each corresponding obligation Service costs are determined based on duration-specific spot rates applied to the service cost cash flows. The interest cost calculation is determined by applying duration specific spot rates to the year-by-year projected benefit payments. The spot yield curve approach does not affect the measurement of the total benefit obligations as the change in service and interest costs offset in the actuarial gains and losses recorded in other comprehensive income For the primary U.S.qualified pension plan, the Company's assumption for the expected return en plan assets was 7.00% in 2019. Projected returns are based primarily on broad, publicly traded equity and fixed-income indices and forward-looking estimates of active portfolio and investment management. As of December 31, 2019, the Company's 2020 expected long-term rate of return on U.S. plan assets is 6.75%. The expected retum assumption is based on the strategic asset allocation of the plan, long term capital market retum expectations and expected performance from active investment management. The 2019 expected long-term rate of retumis based on an asset allocation assumption of 23% global equities, 14% private equities, 47% fixed-income securities, and 16% absolute return investments independent of traditional performance benchmarks, along with positive returns from active investment management. The actual net rate of return on plan assets in 2019 was 16.3%. In 2018 the planeamed a rate of return of 0.5% and in 2017 earned a return of 12.4%. The average annual actual return on the plan assets over the past 10 and 25 years has been 8.9% and 945, respectively. Return on assets assumptions for interational pension and other post-retirement benefit plans are calculated on plan-by-plan basis using plan asset allocations and expected long-term rate of return assumptions As of December 31, 2019, the Company converted to the Pri-2012 Aggregate Mortality Table and updated the mortality improvement scales to the Society of Actuaries Scale MP-2019. The December 31, 2019 update resulted in a small decrease to the US. pension PRO and U.S. accumulated postretirement benefit obligations During 2019, the Company contributed 5207 million to its U.S. and international pension plans and $3 million to its postretirement plans. During 2018, the Company contributed $366 million to its U.S. and international pension plans and S4 million to its postretirement plans. In 2020, the Company expect to contribute an amount in the range of S100 million to $200 million of cash to its US and international retirement plans. The Company does not have a required minimum cash pension contribution obligation for it U.S plans in 2020. Future contributions will depend on market conditions interest rates and other factors Future Pension and Postretirement Benefit Payments The following table provides the estimated pension and postretirement benefit payments that are payable from the plans to participants. Qualified and Non-qualified Pension Benci Postremt (Millions United States Taternasional 2020 Benefit Payments 1.103 $ 246 5 121 2021 Benefit Payments 1,096 253 128 2022 Benefit Payments 1,104 272 136 2023 Benefit Payments 1,106 284 142 2024 Benefit Payments 1111 302 148 Next five years 5,521 1,656 789 Plan Asset Management 3M's investment strategy for its pension and postretirement plans is to manage the funds on a going-concern basis. The primary goal of the trust funds is to meet the obligations as required. The secondary goal is to earn the highest rate of return possible, without jeopardizing its primary goal, and without subjecting the Company to an undue amount of contribution risk. Fund returns are used to help finance present and future obligations to the extent possible within actuarially determined funding limits and tax-determined asset limit, thus reducing the potential need for additional contributions from 3M. The investment strategy has used long duration cash bands and derivative instruments to offset a significant portion of the interest rate sensitivity of U.S. pension liabilities Normally, 3M does not buy or sell any of its own securities as a direct investment for its pension and other postretirement benefit funds. However, due to external investment management of the funds, the plans may indirectly buy, sell or hold 3M securities. The aggregate amount of 3M securities are not considered to be material relative to the aggregate fund percentages The discussion that follows references the fair value measurements of certain assets in terms of levels 1, 2 and 3. See Note 15 for descriptions of these levels. While the company believes the valuation methods are appropriate and consistent with other market participants, the use of different methodologies or assumptions to determine the fair value of certain financial instruments could result in a different estimate of fair value at the reporting date 94 U.S. Pension Plans and Postretirement Benefit Plan Assets In order to achieve the investment objectives in the U.S. pension plans and US postretirement benefit plans, the investment policies include a target strategic asset allocation. The investment policies allow some tolerance around the target in recognition that market Tactations and illiquidity of some investments may cause the allocation to a specific asset class to vary from the target allocation, potentially for long periods of time. Acceptable ranges have been designed to allow for deviation from strategic targets and to allow for the opportunity for tactical over and under-weights. The portfolios will normally be rebalanced when the quarter end asset allocation deviates from acceptable ranges. The allocation is reviewed regularly by the named fiduciary of the plans. Approximately 50% of the postretirement benefit plan assets are in a 401(h) account. The 401(h) account assets are in the same trust as the primary US pension plan and invested with the same investment objectives as the primary U.S.pension plan. The fair values of the assets held by the U.S. pension plans by asset class are as follows: (M) Aneta Fair Vale Mentarymeals thing inputs considered Led Level 2 Level 2019 2018 2019 2019 2013 Fair Valea Der 31 2019 2018 2018 5 5 5 1.575 S 130 165 1.234 LIS equities Nous quite Index dng hertil fundit Tools Fred Income $ 1.575 51 1.5 17 53.5775 2975 53.160 S205 44 NOUS francescorts Scoobode NUS.de $ 2,346 518 5 916 57325 61 30 50 24 10 9 2.901 759 475 (5) 2 109 111 II III 53.262 61 52 3.576 799 104 2.950 475 11 9 $65 5 2.351312055.465 447 Tulio Priequiry Growth out Tot Telegt 5 5 5 1.16 51,945 5 45 2,044 52100 5 45 5 5 15 2651175 1145 5 TIN $ 142 2,010 136 N9 129 52,717 2017 5 15 26 115 114 20 412 5 Fland Hudo Partners Te Amo Cashqi Cheganet Repach med deste marty Guivale, valu Tala and Castelese Tool Oh merite faire plan Faire $$ (0) YU S205.025 5.5,612 54.514464 5 -416 (1) (1) 410 870 5 504 525 516557 $15.012 5455259 516,099 $14.01 In accordance with ASC 820-10, certain investments that are measured at fair value wing the net asset value (NAV) per share (or its equivalent) as a practical expedient have not been classified in the fair value hierarchy. The NAV is based on the fair value of the underlying acts owned by the fund, minus its liabilities then divided by the number of units outstanding and is determined by the investment manager or custodian of the fund. The fair value amount presented in this table are intended to permit reconciliation of the fair value hierarchy to the amounts presented in the fair value of plan assets The fair values of the assets held by the postrotirement benefit plans by asset class are as follow Fair Ve Message des LI Lel 2019 2015 2015 Fair Vat De 1 2019 533253563-35 53975 356 34 5 5418541835 5 136 5 12 20 6 4 335 4 537 . 30 16 12 $ 136 SESSIS 5 5 23 (M) Anet Iqtis US. Site Index and maybe Yol Fixed the US Non US cities Somebode Now Serwe bonds Derive Total Fed Income Prvate Equity Chi H. Total Private Equity Ahol Rem Fincome and other Partnership in Tool Art Chandquivalent Cowest Repurchgement de mar Cachoed teet value Total Total Dermoclo for Vale of plast Film 92 96 2 101 101 5 55 90 27 15 104 55 15 5335 47 5 15 5 45 55 557653 22 31 19 5 1.3615 513513) S 5 In accordance with ASC 820-10.certain investments that are measured at fair value using the NAV per share (or its equivalent) as a practical expedient have not been classified in the fair value hierarchy The NAV is based on the fair value of the underlying assets owned by the fund, minus its liabilities then divided by the number of units outstanding and is determined by the investment manager or custodian of the fund. The fair value amounts presented in this table are intended to permit reconciliation of the fair value hierarchy to the amounts presented in the fair value of plan assets. Publicly traded equities are valued at the closing price reported in the active market in which the individual securities are traded. Fixed income includes derivative instruments such as credit default swaps, interest rate swaps and futures contracts Corporate debt includes bonds and notes, asset backed securities, collateralized mortgage obligations and private placements. Swaps and derivative instruments are valued by the custodian using closing market swap curves and market derved po US government and government agency bonds and notes are valued at the closing price reported in the active market in which the individual security is traded. Corporate bonds and notes, asset backed securities and collateralized mortgage obligations are valued at either the yields currently available on comparable securities of issues with similar credit ratings or valued under a discounted cash flow approach that utilues observable inputs, such as current yields of similar instruments, but includes adjustments for certain risks that may not be oblievable such as credit and liquidity risk. Private placements are valued by the custodian asing recognised pricing services and Source The private equity portfolio is a diversified mix of derivative instruments, growth quity and partnership interests Derivative investments are written options that are valued by independent parties using market inputs and valuation models. Growth equity investments are valued at the closing price reported in the active market in which the individual securities are trade Absolute return consists primarily of partnership interests in hodge funds, hedge fund of funds or other private fund vehicles Corporate debt instruments are valued at either the yields currently available on companhe securities of users with similar credit a Love 2014 Fair Valeat Dec. 31. 2019 2015 2019 2018 5 5 6 . 70 Tatings or valued under a discounted cash flow approach that utilizes observable inputs, such as current yields of similar instruments, but includes adjustments for certain risks that may not be observable such as credit and liquidity risk ratings Other items to reconcile to fair value of plan assets include, interest receivables, amounts due for secunities sold, amounts payable for securities purchased and interest payable. The bulances of and changes in the fair values of the US. pension plans and postretirement plans' level 3 assets for the periods ended December 31, 2019 and 2018 were not material International Pension Plans Assets Outside the U.S. pension plan assets are typically managed by decentralized fiduciary committee. The disclosure below of asset categories is presented in aggregate for over 70 defined benefit plans in 25 countries, however, there is significant variation in asset allocation policy from country to country. Local regulations, local funding rules and local financial and tax considerations are part of the funding and investment allocation process in each country. The Company provides standard funding and investment guidance to all international plans with more focused guidance to the larger plans Each plan has its own strategic asset allocation. The asset allocations are reviewed periodically and rebulanced when necessary The fair values of the asets held by the international pension plans by asset class are as followe Value Mount thing Inpais Considered (Milli Level Level Asset Com qui Growth 30 SS208S - S Ves Care 55 5 quities eve Teal 51 5 55 You can Dementi 5 16 5 35 5151 5 4 55 705 620 Fami 150 121 625 71 Countdown 1. 16 1.OSS Fixeris, va 149 961 Telede SS505 206 1.065 5 14 5 3.45 3.10 Piquity 2075 5 Real estate and the Partnership investments Total 5 4 5 335 $ 210 Ahair Deri 2 low su 50 O Other det value 1 Hunde 195 186 Total About 717 725 Chand China Cand curve 5 94 71 5 5 133 5 Gamband met Total and Frente SS 134 94 Total 5 5 5 5 5 5 540 5527 56976 5223 Other items to concile to fair value of plant 103 (50 Fale of S6923 5170 "In accordance with ASC 820-10, certain investments that are measured at far vale ning the NAV per share (or its equivalent) as a practical expedient have not been classified in the fair value hierarchy The NAV is based on the fair value of the underlying assets owned by the fund, minus its liabilities then divided by the number of its outstanding and is determined by the investment manager or custodian of the fund. The fair value amounts presented in this table amended to permit reconciliation of the fair value hierarchy to the amounts presented in the fair value of planets. 51.345 200 76 488 154 02 IN 16 S2312 5 2014 sa 233 5 39 NE S 22 993 9 9 $* 5 4 5 1 5 36 85 37 89 5 3 5 496 5 5 SH 504 5 5 5 5 1 5 5 Equities consist primarily of mandates in public equity securities managed to various public equity indices Publicly traded equities are valued at the closing price reported in the active market in which the individual securities are traded Fixed Income investments include domestic and foreign government, and corporate, including mortgage backed and other debt) securities Governments, corporate bonds and notes and mortgage backed securities are valued at the closing price reported if traded on an active market or at yields currently available on comparable securities of issues with similar credit ratings or valued under a discounted cash flow approach that utilizes observable inputs, such as current yields of similar instruments, but includes adjustments for certain risks that may not be observable such as credit and liquidity risks Private equity funds consist of partnership interests in a variety of funds. Real estate consists of property funds and REITS (Real Estate Investment Trusts). REITS are valued at the closing price reported in the active market in which it is traded. Absolute return consists of private partnership interests in hedge funds, insurance contracts, derivative instruments, hedge fund of funds, and other alterative investments. Insurance consists of insurance contracts, which are valued using cash surrender values which is the amount the plan would receive if the contract was cashed out at year end. Derivative instruments consist of interest rate swaps that are used to help manage risk Other items to reconcile to fuir value of plan assets include the net of interest receivables, amounts due for securities sold, amounts payable for securities purchased and interest payable. The balance of and changes in the fair values of the international pension plans' level 3 assets consist primarily of insurance contracts under the absolute return asset class. The aggregate of net purchases and net unrealized gains increased this balance by $17 million in 2019 and decreased this balance by $11 million in 2018 NOTE 14. Derivatives The Company uses interest rate swaps, currency swaps, commodity price swaps, and forward and option contracts to manage risks generally associated with foreign exchange rate, interest rate and commodity price fluctuations. The information that follows explains the various types of derivatives and financial instruments used by JM, how and why 3M uses such instruments, how such instruments are accounted for, and how such instruments impact 3M's financial position and performance 3M adopted ASU No 2017-12. Targeted Improvements to Accounting for Hedging Activities as of January 1, 2019. The disclosures contained within this note have been updated to reflect the new guidance, except for prior period amounts presented as the disclosure changes were adopted prospectively. For derivative instruments that are designated in a cash flow or fair value hedging relationship, the impact of this accounting standard was to remove the requirement to test for ineffectiveness. Prior to the adoption of this ASU, any gain or loss related to hedge ineffectiveness was recognized in current carnings. For any net investment hedges entered into on or after January 1, 2019, amounts excluded from the assessment of hedge effectiveness, including the time value of the forward contract at the inception of the hedge, are recognized in earnings using an amortization approach over the life of the hedging instrument on a straight- finc basis. Any difference between the change in the fair value of the excluded component and the amount amortized into camnings during the period is recorded in cumulative translation within other comprehensive income. Additional information with respect to derivatives is included elsewhere as follows: Impact on other comprehensive income of nonderivative hedging and derivative instruments is included in Note 8. Fair value of derivative instruments is included in Note 15. Derivatives ander hedging instruments associated with the Company's long-term diebt are also described in Note 12 Types of Derivatives/Medging Instruments and Inclusion in Income Other Comprehensive Income Cash Flow Hedges For derivative Instruments that are designated and quality as cash flow hedges, the gain or loss on the derivative is reported as a component of other comprehensive income and reclassified into camnings in the same period during which the hedged transaction 98 - NOTE 13. Pension and Postretirement Benefit Plans 3M has company-sponsored retirement plans covering substantially all U.S. employees and many employees outside the United States. In total, 3M has over 75 defined benefit plans in 28 countries. Pension benefits associated with these plans generally are based on each participant's years of service, compensation, and age at retirement or termination. The primary U.S. defined benefit pension plan was closed to new participants effective January 1, 2009. The Company also provides certain postretirement health care and life insurance benefits for its U.S. employees who reach retirement age while employed by the Company and were employed by the Company prior to January 1, 2016. Most international employees and retirees are covered by government health care programs. The cost of company provided postretirement health care plans for international employees is not material and is combined with U.S. amounts in the tables that follow The Company has made deposits for its defined benefit plans with independent trustees. Trust funds and deposits with insurance companies are maintained to provide pension benefits to plan participants and their beneficiaries. There are no plan assets in the non- qualified plan due to its nature. For its U.S. postretirement health care and life insurance benefit plans, the Company has set aside amounts at least equal to annual benefit payments with an independent trustee. The Company also sponsors employee savings plans under Section 401(k) of the Internal Revenue Code. These plans are offered to substantially all regular U.S. employees. For eligible employees hired prior to January 1, 2009, employee 401(k) contributions of up to 5% of eligible compensation matched in cash at rates of 45% or 60%, depending on the plan in which the employee participates. Employees hired on or after January 1, 2009, receive a cash match of 100% for employee 401(k) contributions of up to 3% of eligible compensation and receive an employer retirement income account cash contribution of 3% of the participant's total eligible compensation. All contributions are invested in a number of investment funds pursuant to the employees' elections. Employer contributions to the U.S. defined contribution plans were $186 million $173 million and $159 million for 2019, 2018 and 2017, respectively. 3M subsidiaries in various international countries also participate in defined contribution plans. Employer contributions to the international defined contribution plans were $96 million, 599 million and $88 million for 2019, 2018 and 2017, respectively In May 2019 (as part of the 2019 restructuring actions discussed in Note 5), the Company began offering a voluntary early retirement incentive program to certain eligible participants of its U.S. pension plans who meet age and years of pension service requirements. The eligible participants who accepted the offer and retired by July 1, 2019 received an enhanced pension benefit. Pension benefits were enhanced by adding one additional year of pension service and one additional year of age for certain benefit calculations 89 Approximately 800 participants accepted the offer and retired before July 1 2019. As a result, the Company incurred a $35 million charge related to these special termination benefits in the second quarter of 2019, In the fourth quarter of 2019, the Company recognized a non-operating 532 million settlement expense in its U.S. on-qualified pension plan. The charge is related to lump sum payments made to employees at setisement. The settlement expense is an accelerated recognition of past actuarial losses In May 2019, 3M modified the 3M Retiree Life Insurunce Plan postretirement benefit to close it to new participants effective August 1. 2019 (which results in employees who retire on or after August 1, 2019 not being eligible to participate in the plan) and reducing the maximum life insurance and death benefit to SR.000 for deaths on or after August 1. 2019. Due to these changes the plan was re- measured in the second quarter of 2019, resulting in a decrease to the accumulated projected benefit obligation liability of approximately 150 million and a related increase to shareholders equity, specifically accumulated other comprehensive income in addition to an immaterial income statement benefit prospectively, The following tables include a reconciliation of the beginning and ending balances of the benefit obligation and the fair value of plan assets as well as a summary of the related amounts recognized in the Company's consolidated balance sheet as of December 31 of the respective years. 3M also has certain non-qualified unfunded pension and postretirement benefit plans, inclusive of plans related to supplement excess benefits for employees impacted by particular relocations and other matters that individually and in the aggregate are not significant and which are not included in the tables that follow. The obligations for these plans are included within other Tiabilities in the Company's consolidated balance sheet and aggregated less than 540 million as of December 31, 2019 and 2018 Pestre Outtalai Nee potted International 28 2013 2015 2019 2011 2.209 906 Si Change in benefit obligation Benefit obligation at beginning of year Acquisitions Trasfers Service cost Interest cost Participant contributions Foreign exchange rate changes Plan amendments Actuarial (gain) loss Benefit payments Sentiments, curtailmentsspecial termination benefits and other Benefit obligation at end of year Change in plan assets Fair value of plan assets at beginning of yeas Acquisitions Transfers Actual return on planets Company contributions Participant contributions Foreign exchange rate changes Benefit payments Settlement, curtailments, special termination benefits and other Fair value of plan assets at end of year Funded is at end of year $ 15,948 517360 S 6.965 $ 7.502 52.175 52.410 9 (11) 251 25 131 143 43 S2 620 363 156 157 82 79 7 9 55 (387) (13) 3 7 (171) 1.226) (144) 225 (244) (1.128) (302) 304) (112) (109 35 $ 17,935 S 15.96857,931 56.965 52.242 $ 2.175 $ 14,803 5.15686 S 6170 S 6,737 $ 1.260 $ 1.397 (4) 2.323 (95) (38) (32) 101 106 112 3 7 9 80 (346) (1.128) 1.034) (302) (300 (112) (109) 858 187 (4) $ 16,099 S 14801 5.923 561705 1.138 $ 1260 $(1.836) $ (1.145 S (1,008) 5 (795) S (904) 5 (915) Qualified and Non-qualified Pension Menefits Prement United States International MI) Besc 2019 2018 2019 2018 2 Amounts recognized in the Consolidated Balance Sheet as of Dec. 31, Non-current assets s 230 S 2085 Accrued benefit cost Current liabilities (48) (60) (15) (13) (4) 3 Non-current liabilities (1.788) (1.085) (1.223) 1990) (900) 1912) Ending balance S (1.836) S (1.145) S (1,008) S (795) S 1904) 5 (915 Qualified and qualified Pension Benefits Potretirement wid States International Bencin Milli 2019 2018 2019 2018 2018 Amounts recognized in accumulated other comprehensive income as of Dec. 31. Net transition obligation (asset) 10 S Net actuarial loss (ga) 5.899 3,374 1,967 1.713 663 384 Prior service cost (credit) (128) (152) (5) (20) (262) (125) Ending balance 55,771 55,222 S 1,972 S 1.6935 401 461 The balance of amounts recognized for international plants in accumulated other comprehensive income as of December 31 in the preceding table are presented based on the foreign currency exchange rate on that date. The pension accumulated benefit obligation represents the actuarial present value of hencfits based on employee service and compensation as of the measurement date and does not include an assumption about future compensation levels. The accumulated benefit obligation of the U.S. pension plans was $17.125 billion and $15.633 billion at December 31, 2019 and 2018, respectively The accumulated benefit obligation of the international pension plans was $7.355 billion and $6.438 billion at December 31, 2019 and 2018, respectively The following amounts relate to pension plans with accumulated benefit obligations in excess of plan assets as of December 31 Qualified and Non-wed Press Millions 2019 SO 2013 Projected benefit obligation $ 17,9355 593 2,986 2,613 Accumulated benefit obligation 17,125 521 2.752 2.415 Fair value of planets 16.099 9 1.778 1.633 S 91 Components of net periodic cost and other amounts recogmired in other comprehensive income The service cost component of delined benefit net periodse benefit cost is recorded in cost of sales, seiling general and administrative expenses, and research, development and related expenses. As discussed in Note 6, the other components of net periodic benefit cost are reflected in other expense (income), net. Components of net periodic benefit cost and other supplemental information for the years ended December 31 follow > 113) 243 : (126) Qualified and Non-gualified Penslewe Pri (M 2019 2018 2017 3019 2011 2019 2017 Net periodic benefitcost benefit) Operating expense Service con 5 2515 28 $268 5 131 5 143 $ 10 $3552 552 Non-operating espese Interest.com 620 563 565 157 157 82 79 80 Expected the plants (1.040) (1087 (1035) (299) 07 (81) 34 (86) Amortization of preserve benefit (24) (23) (23) (13) 33) (401 15. Amortizon of net actitalls 366 503 114 125 34 56 Settlements, curtaiments, special termination benefits and other 70 2 10 $ 0 Total non-operating expense (benefit (10) 7 16 Totalet periode benefit cost benefit) 5 $ 244 S 1655 5124 S50 5 545 Other changes in plan sues and benefit obligations recognised in other comprehensive income) loss Prior service cost benefit) S s 3 $ 75 6 1171) 5 5 (1) Amortation of pornice benefit 24 23 23 30 33 Net actual) 926 (44) 607 344 194 (24) 119 (127) 69 Amortion of net actuarial loss (366) (503) (388) 78 (114) (34) (61) (56) Foreign currency 7 183) 167 2 Settlements and curtailments (35 15 Total recognized in other comprehensive (income) low 55495.94 $240 S2805 13.5 (59) 5.50 5.65 Toulon nel periodic benefits (hencfind other comprehensive income lo 5 792 S 280) $ 40$ $ 344 55 (64) S (82) 5110 Weighted average assumptions used to determine benefit obligations as of December 31, Qualidad Non-golfindes Poster United States Brin 2019 2018 2019 2019 2017 Discount rate 3.25% 4,36% 3.68% 18152305 245 3.27% 4.41% 3.79% Compensation rate increase 3.21% 4,10 % 4,10% 2.88% 2.89% 2.89% NA NA NA Weighted average assumptions used to determine netcost for years eaded December 31 Chutties and Mentitled treates ited States theme 2019 2018 2011 Discount rate service cost 4.44% 3.785 4.42 2.39% 2.25 2325 453% 3.86% 450 Discount rate interest cost 4,02% 335 % 3.615 2.26 % 214 2255 4.15% 3.52% 3.80 Expected return on 7.00% 7.25 5725 4.9055025 5.165 643 % 6,53% 6,48% Compensation rate increase 4.10 % 4105 4.10% 2.89% 2.89% 2.905 NA NA NA 92 The Company provides eligible retiroes in the US postretirement health care benefit plans to a savings account benefits-based plan. The contributions provided by the Company to the health savings accounts increase percent per year for employees who retired prior to January 1 2016 and increase 15 percent for employees who retire on or after January 1, 2016. Therefore, the Company no longer has material exposure to health care cost inflation The Company determines the discount rate used to measure plan liabilities as of the December 31 measurement date for the pension and postretirement benefit plans, which is also the date used for the related annual measurement assumptions. The discount rate reflects the current rate at which the associated liabilities could be effectively settled at the end of the year. The Company sets its rate to reflect the yield of a portfolio of high quality, fixed-income debt instruments that would produce cash flows sufficient in timing and amount to settle projected future benefits. Using this methodology, the Company determined a discount rate of 3.25% for the US pension plans and 3.27% for the postretirement benefit plans as of December 31, 2019, which is a decrease of 11 percentage points and 114 percentage points, respectively, from the rates used as of December 31, 2018. A decrease in the discount rate increases the Projected Benefit Obligation (PBO), the significant decrease in the discount rate as of December 31, 2019 resulted in an approximately $2.0 billion higher PRO for the US pension plans. For the interational pension and postretirement plans the discount rates also reflect the current rate at which the associated liabilities could be effectively settled at the end of the year. If the country has a deep market in corporate bonds the Company matches the expected cash flows from the plan either to a portfolio of bonds that generate sufficient cash flow or a notional yield eurve generated from available bond information. In countries that do not have a deep market in corporate boods, government bonds are considered with a risk premium to approximate corporate bond yield The Company measures service cost and interest cost separately using the spot yield curve approach applied to each corresponding obligation Service costs are determined based on duration-specific spot rates applied to the service cost cash flows. The interest cost calculation is determined by applying duration specific spot rates to the year-by-year projected benefit payments. The spot yield curve approach does not affect the measurement of the total benefit obligations as the change in service and interest costs offset in the actuarial gains and losses recorded in other comprehensive income For the primary U.S.qualified pension plan, the Company's assumption for the expected return en plan assets was 7.00% in 2019. Projected returns are based primarily on broad, publicly traded equity and fixed-income indices and forward-looking estimates of active portfolio and investment management. As of December 31, 2019, the Company's 2020 expected long-term rate of return on U.S. plan assets is 6.75%. The expected retum assumption is based on the strategic asset allocation of the plan, long term capital market retum expectations and expected performance from active investment management. The 2019 expected long-term rate of retumis based on an asset allocation assumption of 23% global equities, 14% private equities, 47% fixed-income securities, and 16% absolute return investments independent of traditional performance benchmarks, along with positive returns from active investment management. The actual net rate of return on plan assets in 2019 was 16.3%. In 2018 the planeamed a rate of return of 0.5% and in 2017 earned a return of 12.4%. The average annual actual return on the plan assets over the past 10 and 25 years has been 8.9% and 945, respectively. Return on assets assumptions for interational pension and other post-retirement benefit plans are calculated on plan-by-plan basis using plan asset allocations and expected long-term rate of return assumptions As of December 31, 2019, the Company converted to the Pri-2012 Aggregate Mortality Table and updated the mortality improvement scales to the Society of Actuaries Scale MP-2019. The December 31, 2019 update resulted in a small decrease to the US. pension PRO and U.S. accumulated postretirement benefit obligations During 2019, the Company contributed 5207 million to its U.S. and international pension plans and $3 million to its postretirement plans. During 2018, the Company contributed $366 million to its U.S. and international pension plans and S4 million to its postretirement plans. In 2020, the Company expect to contribute an amount in the range of S100 million to $200 million of cash to its US and international retirement plans. The Company does not have a required minimum cash pension contribution obligation for it U.S plans in 2020. Future contributions will depend on market conditions interest rates and other factors Future Pension and Postretirement Benefit Payments The following table provides the estimated pension and postretirement benefit payments that are payable from the plans to participants. Qualified and Non-qualified Pension Benci Postremt (Millions United States Taternasional 2020 Benefit Payments 1.103 $ 246 5 121 2021 Benefit Payments 1,096 253 128 2022 Benefit Payments 1,104 272 136 2023 Benefit Payments 1,106 284 142 2024 Benefit Payments 1111 302 148 Next five years 5,521 1,656 789 Plan Asset Management 3M's investment strategy for its pension and postretirement plans is to manage the funds on a going-concern basis. The primary goal of the trust funds is to meet the obligations as required. The secondary goal is to earn the highest rate of return possible, without jeopardizing its primary goal, and without subjecting the Company to an undue amount of contribution risk. Fund returns are used to help finance present and future obligations to the extent possible within actuarially determined funding limits and tax-determined asset limit, thus reducing the potential need for additional contributions from 3M. The investment strategy has used long duration cash bands and derivative instruments to offset a significant portion of the interest rate sensitivity of U.S. pension liabilities Normally, 3M does not buy or sell any of its own securities as a direct investment for its pension and other postretirement benefit funds. However, due to external investment management of the funds, the plans may indirectly buy, sell or hold 3M securities. The aggregate amount of 3M securities are not considered to be material relative to the aggregate fund percentages The discussion that follows references the fair value measurements of certain assets in terms of levels 1, 2 and 3. See Note 15 for descriptions of these levels. While the company believes the valuation methods are appropriate and consistent with other market participants, the use of different methodologies or assumptions to determine the fair value of certain financial instruments could result in a different estimate of fair value at the reporting date 94 U.S. Pension Plans and Postretirement Benefit Plan Assets In order to achieve the investment objectives in the U.S. pension plans and US postretirement benefit plans, the investment policies include a target strategic asset allocation. The investment policies allow some tolerance around the target in recognition that market Tactations and illiquidity of some investments may cause the allocation to a specific asset class to vary from the target allocation, potentially for long periods of time. Acceptable ranges have been designed to allow for deviation from strategic targets and to allow for the opportunity for tactical over and under-weights. The portfolios will normally be rebalanced when the quarter end asset allocation deviates from acceptable ranges. The allocation is reviewed regularly by the named fiduciary of the plans. Approximately 50% of the postretirement benefit plan assets are in a 401(h) account. The 401(h) account assets are in the same trust as the primary US pension plan and invested with the same investment objectives as the primary U.S.pension plan. The fair values of the assets held by the U.S. pension plans by asset class are as follows: (M) Aneta Fair Vale Mentarymeals thing inputs considered Led Level 2 Level 2019 2018 2019 2019 2013 Fair Valea Der 31 2019 2018 2018 5 5 5 1.575 S 130 165 1.234 LIS equities Nous quite Index dng hertil fundit Tools Fred Income $ 1.575 51 1.5 17 53.5775 2975 53.160 S205 44 NOUS francescorts Scoobode NUS.de $ 2,346 518 5 916 57325 61 30 50 24 10 9 2.901 759 475 (5) 2 109 111 II III 53.262 61 52 3.576 799 104 2.950 475 11 9 $65 5 2.351312055.465 447 Tulio Priequiry Growth out Tot Telegt 5 5 5 1.16 51,945 5 45 2,044 52100 5 45 5 5 15 2651175 1145 5 TIN $ 142 2,010 136 N9 129 52,717 2017 5 15 26 115 114 20 412 5 Fland Hudo Partners Te Amo Cashqi Cheganet Repach med deste marty Guivale, valu Tala and Castelese Tool Oh merite faire plan Faire $$ (0) YU S205.025 5.5,612 54.514464 5 -416 (1) (1) 410 870 5 504 525 516557 $15.012 5455259 516,099 $14.01 In accordance with ASC 820-10, certain investments that are measured at fair value wing the net asset value (NAV) per share (or its equivalent) as a practical expedient have not been classified in the fair value hierarchy. The NAV is based on the fair value of the underlying acts owned by the fund, minus its liabilities then divided by the number of units outstanding and is determined by the investment manager or custodian of the fund. The fair value amount presented in this table are intended to permit reconciliation of the fair value hierarchy to the amounts presented in the fair value of plan assets The fair values of the assets held by the postrotirement benefit plans by asset class are as follow Fair Ve Message des LI Lel 2019 2015 2015 Fair Vat De 1 2019 533253563-35 53975 356 34 5 5418541835 5 136 5 12 20 6 4 335 4 537 . 30 16 12 $ 136 SESSIS 5 5 23 (M) Anet Iqtis US. Site Index and maybe Yol Fixed the US Non US cities Somebode Now Serwe bonds Derive Total Fed Income Prvate Equity Chi H. Total Private Equity Ahol Rem Fincome and other Partnership in Tool Art Chandquivalent Cowest Repurchgement de mar Cachoed teet value Total Total Dermoclo for Vale of plast Film 92 96 2 101 101 5 55 90 27 15 104 55 15 5335 47 5 15 5 45 55 557653 22 31 19 5 1.3615 513513) S 5 In accordance with ASC 820-10.certain investments that are measured at fair value using the NAV per share (or its equivalent) as a practical expedient have not been classified in the fair value hierarchy The NAV is based on the fair value of the underlying assets owned by the fund, minus its liabilities then divided by the number of units outstanding and is determined by the investment manager or custodian of the fund. The fair value amounts presented in this table are intended to permit reconciliation of the fair value hierarchy to the amounts presented in the fair value of plan assets. Publicly traded equities are valued at the closing price reported in the active market in which the individual securities are traded. Fixed income includes derivative instruments such as credit default swaps, interest rate swaps and futures contracts Corporate debt includes bonds and notes, asset backed securities, collateralized mortgage obligations and private placements. Swaps and derivative instruments are valued by the custodian using closing market swap curves and market derved po US government and government agency bonds and notes are valued at the closing price reported in the active market in which the individual security is traded. Corporate bonds and notes, asset backed securities and collateralized mortgage obligations are valued at either the yields currently available on comparable securities of issues with similar credit ratings or valued under a discounted cash flow approach that utilues observable inputs, such as current yields of similar instruments, but includes adjustments for certain risks that may not be oblievable such as credit and liquidity risk. Private placements are valued by the custodian asing recognised pricing services and Source The private equity portfolio is a diversified mix of derivative instruments, growth quity and partnership interests Derivative investments are written options that are valued by independent parties using market inputs and valuation models. Growth equity investments are valued at the closing price reported in the active market in which the individual securities are trade Absolute return consists primarily of partnership interests in hodge funds, hedge fund of funds or other private fund vehicles Corporate debt instruments are valued at either the yields currently available on companhe securities of users with similar credit a Love 2014 Fair Valeat Dec. 31. 2019 2015 2019 2018 5 5 6 . 70 Tatings or valued under a discounted cash flow approach that utilizes observable inputs, such as current yields of similar instruments, but includes adjustments for certain risks that may not be observable such as credit and liquidity risk ratings Other items to reconcile to fair value of plan assets include, interest receivables, amounts due for secunities sold, amounts payable for securities purchased and interest payable. The bulances of and changes in the fair values of the US. pension plans and postretirement plans' level 3 assets for the periods ended December 31, 2019 and 2018 were not material International Pension Plans Assets Outside the U.S. pension plan assets are typically managed by decentralized fiduciary committee. The disclosure below of asset categories is presented in aggregate for over 70 defined benefit plans in 25 countries, however, there is significant variation in asset allocation policy from country to country. Local regulations, local funding rules and local financial and tax considerations are part of the funding and investment allocation process in each country. The Company provides standard funding and investment guidance to all international plans with more focused guidance to the larger plans Each plan has its own strategic asset allocation. The asset allocations are reviewed periodically and rebulanced when necessary The fair values of the asets held by the international pension plans by asset class are as followe Value Mount thing Inpais Considered (Milli Level Level Asset Com qui Growth 30 SS208S - S Ves Care 55 5 quities eve Teal 51 5 55 You can Dementi 5 16 5 35 5151 5 4 55 705 620 Fami 150 121 625 71 Countdown 1. 16 1.OSS Fixeris, va 149 961 Telede SS505 206 1.065 5 14 5 3.45 3.10 Piquity 2075 5 Real estate and the Partnership investments Total 5 4 5 335 $ 210 Ahair Deri 2 low su 50 O Other det value 1 Hunde 195 186 Total About 717 725 Chand China Cand curve 5 94 71 5 5 133 5 Gamband met Total and Frente SS 134 94 Total 5 5 5 5 5 5 540 5527 56976 5223 Other items to concile to fair value of plant 103 (50 Fale of S6923 5170 "In accordance with ASC 820-10, certain investments that are measured at far vale ning the NAV per share (or its equivalent) as a practical expedient have not been classified in the fair value hierarchy The NAV is based on the fair value of the underlying assets owned by the fund, minus its liabilities then divided by the number of its outstanding and is determined by the investment manager or custodian of the fund. The fair value amounts presented in this table amended to permit reconciliation of the fair value hierarchy to the amounts presented in the fair value of planets. 51.345 200 76 488 154 02 IN 16 S2312 5 2014 sa 233 5 39 NE S 22 993 9 9 $* 5 4 5 1 5 36 85 37 89 5 3 5 496 5 5 SH 504 5 5 5 5 1 5 5 Equities consist primarily of mandates in public equity securities managed to various public equity indices Publicly traded equities are valued at the closing price reported in the active market in which the individual securities are traded Fixed Income investments include domestic and foreign government, and corporate, including mortgage backed and other debt) securities Governments, corporate bonds and notes and mortgage backed securities are valued at the closing price reported if traded on an active market or at yields currently available on comparable securities of issues with similar credit ratings or valued under a discounted cash flow approach that utilizes observable inputs, such as current yields of similar instruments, but includes adjustments for certain risks that may not be observable such as credit and liquidity risks Private equity funds consist of partnership interests in a variety of funds. Real estate consists of property funds and REITS (Real Estate Investment Trusts). REITS are valued at the closing price reported in the active market in which it is traded. Absolute return consists of private partnership interests in hedge funds, insurance contracts, derivative instruments, hedge fund of funds, and other alterative investments. Insurance consists of insurance contracts, which are valued using cash surrender values which is the amount the plan would receive if the contract was cashed out at year end. Derivative instruments consist of interest rate swaps that are used to help manage risk Other items to reconcile to fuir value of plan assets include the net of interest receivables, amounts due for securities sold, amounts payable for securities purchased and interest payable. The balance of and changes in the fair values of the international pension plans' level 3 assets consist primarily of insurance contracts under the absolute return asset class. The aggregate of net purchases and net unrealized gains increased this balance by $17 million in 2019 and decreased this balance by $11 million in 2018 NOTE 14. Derivatives The Company uses interest rate swaps, currency swaps, commodity price swaps, and forward and option contracts to manage risks generally associated with foreign exchange rate, interest rate and commodity price fluctuations. The information that follows explains the various types of derivatives and financial instruments used by JM, how and why 3M uses such instruments, how such instruments are accounted for, and how such instruments impact 3M's financial position and performance 3M adopted ASU No 2017-12. Targeted Improvements to Accounting for Hedging Activities as of January 1, 2019. The disclosures contained within this note have been updated to reflect the new guidance, except for prior period amounts presented as the disclosure changes were adopted prospectively. For derivative instruments that are designated in a cash flow or fair value hedging relationship, the impact of this accounting standard was to remove the requirement to test for ineffectiveness. Prior to the adoption of this ASU, any gain or loss related to hedge ineffectiveness was recognized in current carnings. For any net investment hedges entered into on or after January 1, 2019, amounts excluded from the assessment of hedge effectiveness, including the time value of the forward contract at the inception of the hedge, are recognized in earnings using an amortization approach over the life of the hedging instrument on a straight- finc basis. Any difference between the change in the fair value of the excluded component and the amount amortized into camnings during the period is recorded in cumulative translation within other comprehensive income. Additional information with respect to derivatives is included elsewhere as follows: Impact on other comprehensive income of nonderivative hedging and derivative instruments is included in Note 8. Fair value of derivative instruments is included in Note 15. Derivatives ander hedging instruments associated with the Company's long-term diebt are also described in Note 12 Types of Derivatives/Medging Instruments and Inclusion in Income Other Comprehensive Income Cash Flow Hedges For derivative Instruments that are designated and quality as cash flow hedges, the gain or loss on the derivative is reported as a component of other comprehensive income and reclassified into camnings in the same period during which the hedged transaction 98 The assignment is to document what ASC topic reference is applicable to each area of the footnote. You will have to research in the Codification.


Step by Step Solution
There are 3 Steps involved in it
Step: 1

Get Instant Access to Expert-Tailored Solutions
See step-by-step solutions with expert insights and AI powered tools for academic success
Step: 2

Step: 3

Ace Your Homework with AI
Get the answers you need in no time with our AI-driven, step-by-step assistance
Get Started


