Question
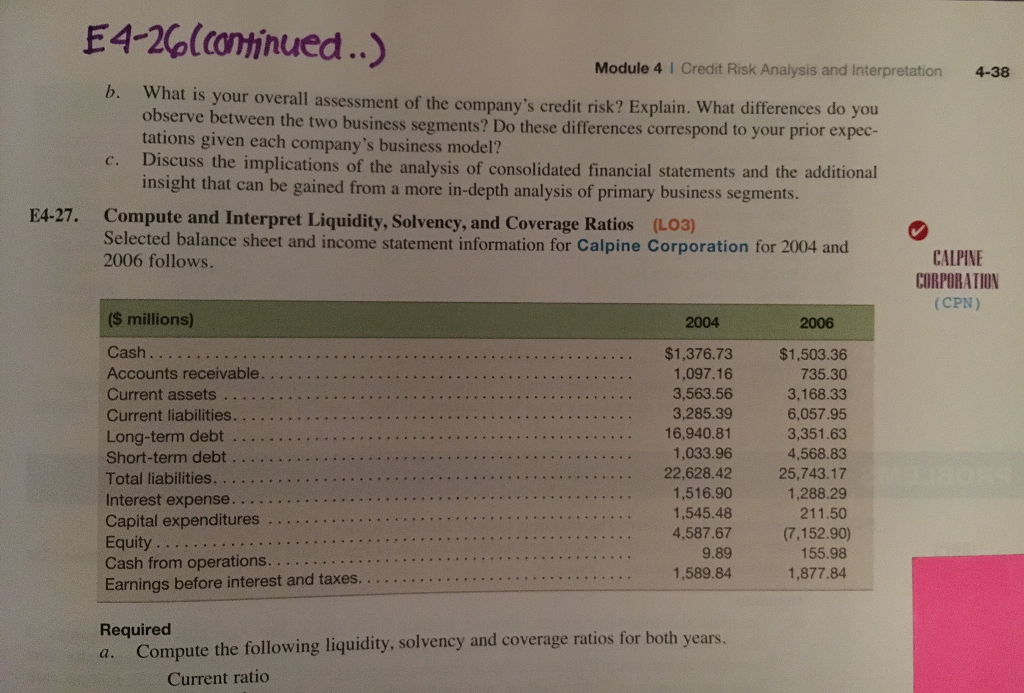
In the attached files are the questions to be answered and the information needed to answer them. Answer all parts of the question completely. Questions:
In the attached files are the questions to be answered and the information needed to answer them. Answer all parts of the question completely.
Questions: 4-26
4-26:
a) Compute the return on equity (ROE), the times interest earned ratio and the total-liabilities-to-equity ratio for 2010 for the companys two business segments and the company as a whole. (Use year-end equity for return on equity calculation).
b) What is your overall assessment of the companys credit risk? Explain. What differences do you observe between the two business segments? Do these differences correspond to your prior expectations given each companys business model?
c) Discuss the implications of the analysis of consolidated financial statements and the additional insight that can be gained from a more in-depth analysis of primary business segments.
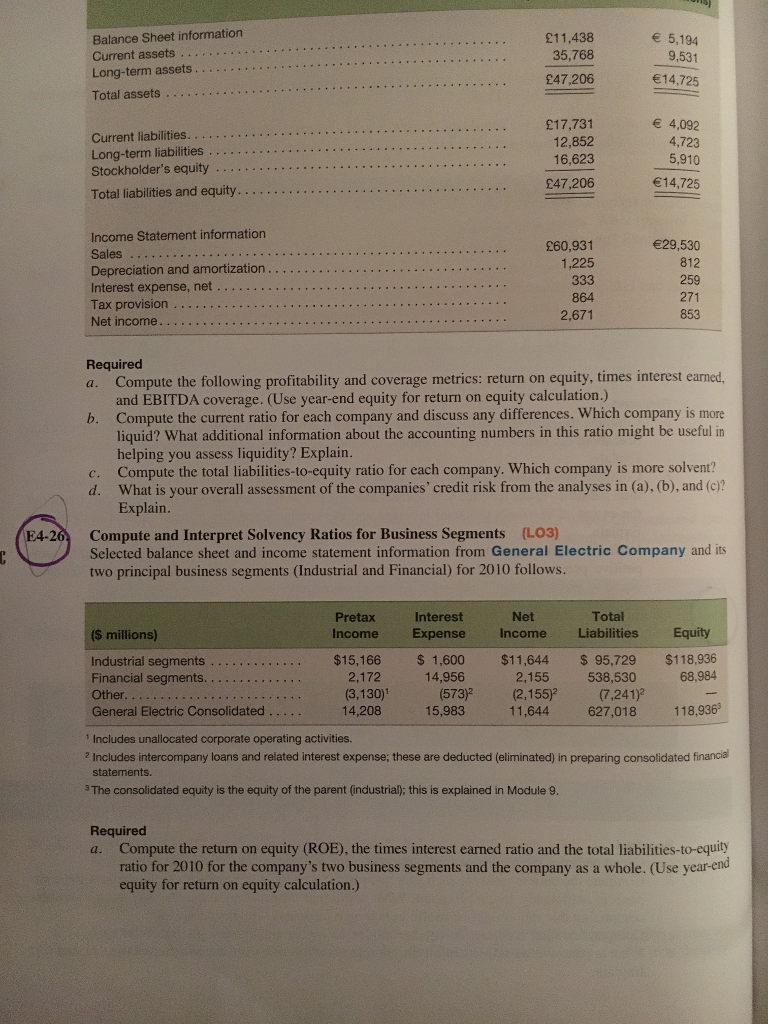
Balance Sheet information Current assets Long-term assets Total assets 11,438 35,768 47,206 5,194 9,531 14,725 Current liabilities. Long-term liabilities Stockholder's equity Total liabilities and equity 17,731 12,852 16,623 247,206 4,092 4,723 5,910 14,725 Income Statement information Sales Depreciation and amortization.. Interest expense, net Tax provision 60,931 1,225 29,530 812 259 271 853 864 2,671 Required a. Compute the following profitability and coverage metrics: return on equity, times interest earned, and EBITDA coverage. (Use year-end equity for return on equity calculation.) Compute the current ratio for each company and discuss any differences. Which company is more liquid? What additional information about the accounting numbers in this ratio might be useful in helping you assess liquidity? Explain Compute the total liabilities-to-equity ratio for each company. Which company is more solvent? What is your overall assessment of the companies' credit risk from the analyses in (a). (b), and (c)? Explain b. c. d. E4-20 Compute and Interpret Solvency Ratios for Business Segments (LO3) Selected balance sheet and income statement information from General Electric Company and its two principal business segments (Industrial and Financial) for 2010 follows. Pretax Interest Net Total S millions) Income Expense Income Liabilities Equity $15,166 1,600 $11,644 $ 95,729 $118,936 2,155 538,530 68,984 Industrial segments Financial segments. Other General Electric Consolidated. 2,172 (3,130) 14,208 14,956 (5732 (2,155)?(7.241) 15,983 11,644 627,018 118,936 Includes unallocated corporate operating activities. 2 Includes intercompany loans and related interest expense; these are deducted (eliminated) in preparing consolidated financial statements. 3 The consolidated equity is the equity of the parent (industrial); this is explained in Module 9 Required a. Compute the return on equity (ROE), the times interest earned ratio and the total liabilities-to-equity ratio for 2010 for the company's two business segments and the company as a whole. (Use year-end equity for return on equity calculation.)
Step by Step Solution
There are 3 Steps involved in it
Step: 1
Get Instant Access to Expert-Tailored Solutions
See step-by-step solutions with expert insights and AI powered tools for academic success
Step: 2
Step: 3
Ace Your Homework with AI
Get the answers you need in no time with our AI-driven, step-by-step assistance
Get Started