Answered step by step
Verified Expert Solution
Question
1 Approved Answer
In the cell below write a script to read the csv file with your collected data. Then, assign the plate separation to a list d]
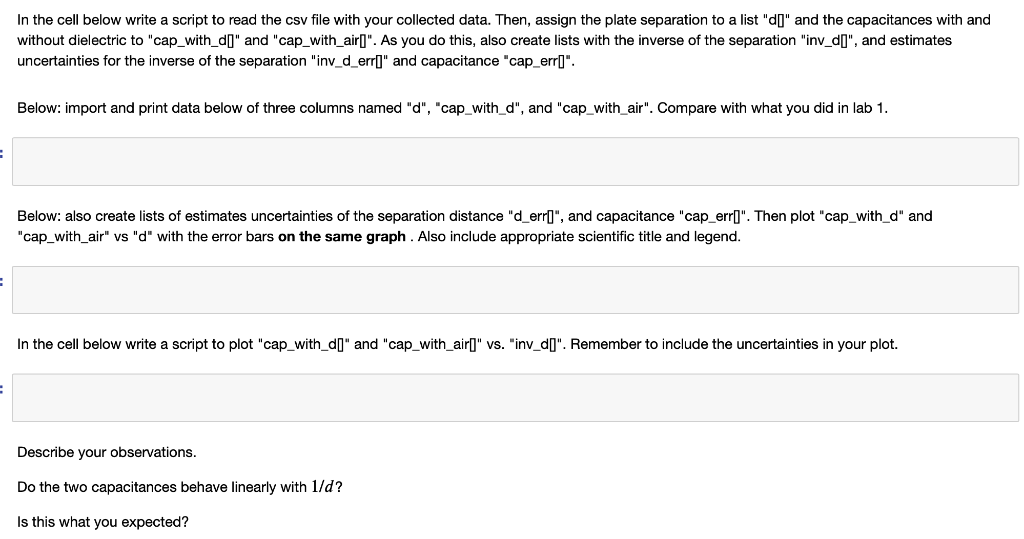
In the cell below write a script to read the csv file with your collected data. Then, assign the plate separation to a list "d]" and the capacitances with and without dielectric to "cap_with_d]" and "cap_with_air]". As you do this, also create lists with the inverse of the separation "inv_d]", and estimates uncertainties for the inverse of the separation "inv_d_err]" and capacitance "cap_err]". Below: import and print data below of three columns named " d ", "cap_with_d", and "cap_with_air". Compare with what you did in lab 1. Below: also create lists of estimates uncertainties of the separation distance "d_err[", and capacitance "cap_err]". Then plot "cap_with_d" and "cap_with_air" vs "d" with the error bars on the same graph. Also include appropriate scientific title and legend. In the cell below write a script to plot "cap_with_d[]" and "cap_with_air]" vs. "inv_d]". Remember to include the uncertainties in your plot. Describe your observations. Do the two capacitances behave linearly with 1/d? Is this what you expected
Step by Step Solution
There are 3 Steps involved in it
Step: 1
Get Instant Access to Expert-Tailored Solutions
See step-by-step solutions with expert insights and AI powered tools for academic success
Step: 2
Step: 3
Ace Your Homework with AI
Get the answers you need in no time with our AI-driven, step-by-step assistance
Get Started