Question
In the Content Section under Assignment is a Powerpoint file with audio input. It sets out the structure of the assignment material. In summary, the
In the Content Section under Assignment is a Powerpoint file with audio input. It sets out the structure of the assignment material. In summary, the task is to examine and compare the performance of three investment portfolios with respect to rate of return and price volatility. Each of the three portfolios is made up of two investment funds. You will assess ten years of historical price information for three investment funds and combine these into the three investment portfolios as follows:
Portfolio One Portfolio Two Portfolio Three
Canadian Fixed income Fund Canadian Equity Fund Canadian Fixed Income Fund
Canadian Equity Fund Global Equity Fund Global Equity Fund
To access each fund's ten-year performance record, use the following link:
Morningstar.ca.ca
Click: Funds
Tools
Fund Screener
Morningstar Category
In Morningstar Category, choose one fund with a ten-year performance history from each of the following three groups:
Canadian Corporate Fixed Income
Canadian Focused Equity
Global Equity
In order to establish the content - either Domestic (Canadian) or Global, of the funds you are selecting for the assignment, you need to hit the Distribution tab under Performance on the Morningstar fund page. . The securities in the fund will not be entirely domestic or global but your choice should indicate that a majority of the holdings reflect what you are seeking.
As an example, the following is a Global Equity fund I have chosen that has been operating since 2006.
https://www.morningstar.ca/ca/report/fund/performance.aspx?t=0P0000NCQK&fundservcode=undefined&lang=en-CA#:~:text=-14.90,10.44
The relevant data to extract is the latest ten-year performance history which for this fund is:
| 2011 | (14.90) |
| 2012 | 12.65 |
| 2013 | 7.77 |
| 2014 | 2.02 |
| 2015 | 1.19 |
| 2016 | 6.90 |
| 2017 | 17.14 |
| 2018 | (1.51) |
| 2019 | 14.50 |
| 2020 | (4.94) |
| Average | 4.08 |

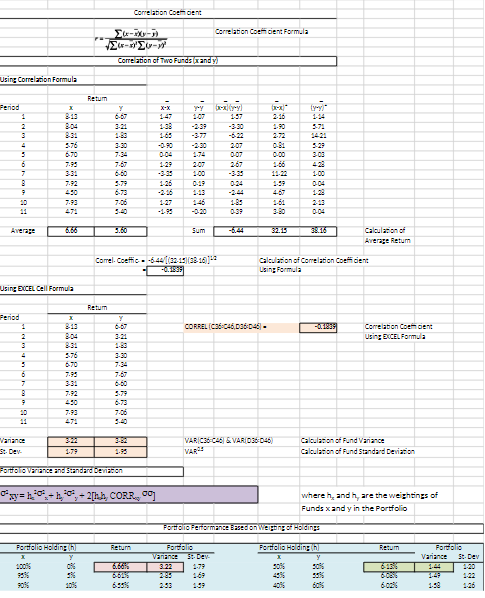
Using Correlation Formula Correlation Comcent x-xx-5) -20- Correlation of Two Funds (x and y) Correlation Coefficient Formula Return Period x Y x-x yy {yy)" 1 813 6-67 1-47 1.07 157 2-16 114 2 8.04 3-21 1-38 -2-39 -3:30 1-90 5.71 3 8.31 1-83 1-65 -3-77 -6-22 2-72 14:21 4 576 3-30 -0-90 -2-30 207 0-81 5:29 5 670 7-34 0.04 1-74 0.07 0.00 3.03 6 7.95 7-67 1.29 2:07 267 1-66 428 7 3-31 6-60 -3-35 1.00 -3-35 11-22 1.00 B 7-92 5-79 1-26 0-19 0:24 1-59 0-04 9 450 6-73 -216 1-13 -2-44 4-67 128 20 7.93 7-06 1-27 146 1-85 1-61 213 11 471 5-40 -195 -0-20 0-39 3-80 0.04 Average 6.66 3.60 Sum -6.44 32.15 38.16 Using EXCEL Cell Formula Correl. Coeffic-6-44/[(32-15)(38-16)]** -0.1839 Calculation of Average Return Calculation of Correlation Coefficient Using Formula Return Period x Y 1 813 6-67 CORREL (C36-C46,036046- -0.1839 2 8:04 3-21 Correlation Comcent Using EXCEL Formula 3 8:31 1-83 4 576 3-30 5 6-70 7-34 6 7.95 7-67 7 3-31 6-60 B 7-92 5-79 9 450 6-73 20 7-93 7-06 11 471 5-40 "Variance St-Dev- 322 179 1-95 VAR C36-C46) & VAR 036-046) VAR Calculation of Fund Variance Calculation of Fund Standard Deviation Portfolio Variance and Standard Deviation xy= h + h0, + 2[h.h, CORR., 0] where h, and h, are the weightings of Funds x and y in the Portfolio Portfolio Performance Based on Weighing of Holdings Portfolio Holding (h) Return Fortfolio Portfolio Holding (h) Return Portfolio - Variance St-Dev- Variance St-Dev 100% 086 6.66% 3.22 1-79 50% 50% 6-136 1-44 1-20 95% 596 6.61% 2.35 1-69 45% 55% 6-0856 1-49 1-22 90% 10% 2:53 139 40% 60% 6.00% 1.58 1-26
Step by Step Solution
There are 3 Steps involved in it
Step: 1

Get Instant Access to Expert-Tailored Solutions
See step-by-step solutions with expert insights and AI powered tools for academic success
Step: 2

Step: 3

Ace Your Homework with AI
Get the answers you need in no time with our AI-driven, step-by-step assistance
Get Started


