

Answered step by step
Verified Expert Solution
Question
1 Approved Answer
In the diagram below, the graphs of f g and h are shown. The graphs intersect at A on the x-axis. The graph of
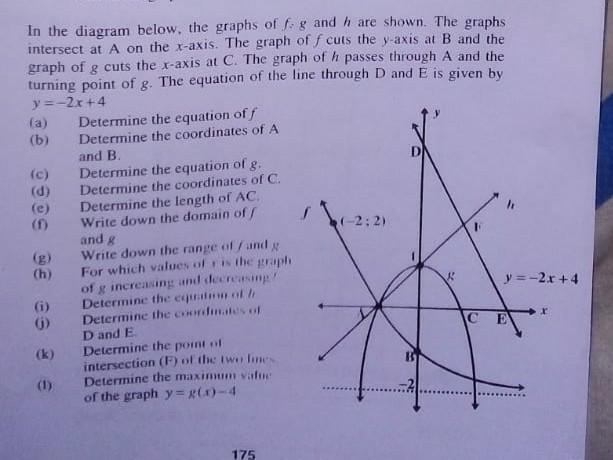
In the diagram below, the graphs of f g and h are shown. The graphs intersect at A on the x-axis. The graph of cuts the y-axis at B and the graph of g cuts the x-axis at C. The graph of h passes through A and the turning point of g. The equation of the line through D and E is given by y=-2x+4 (a) (b) (c) (d) (e) (f) 32 9609 @ 86 (g) (h) (i) () (k) Determine the equation of f Determine the coordinates of A and B. Determine the equation of g. Determine the coordinates of C. Determine the length of AC. Write down the domain off and g Write down the range of /and g For which values of is the graphi of g increasing and decreasing Determine the equation of h Determine the coordinates of D and E Determine the point of intersection (F) of the two lines Determine the maximum value of the graph y= g(x)-4 (-2:2) C E 175 y=-2x+4
Step by Step Solution
There are 3 Steps involved in it
Step: 1

Get Instant Access to Expert-Tailored Solutions
See step-by-step solutions with expert insights and AI powered tools for academic success
Step: 2

Step: 3
Ace Your Homework with AI
Get the answers you need in no time with our AI-driven, step-by-step assistance
Get Started
Classical Mechanics
Authors: Herbert Goldstein, Charles P Poole
3rd Edition
0201657023, 9780201657029