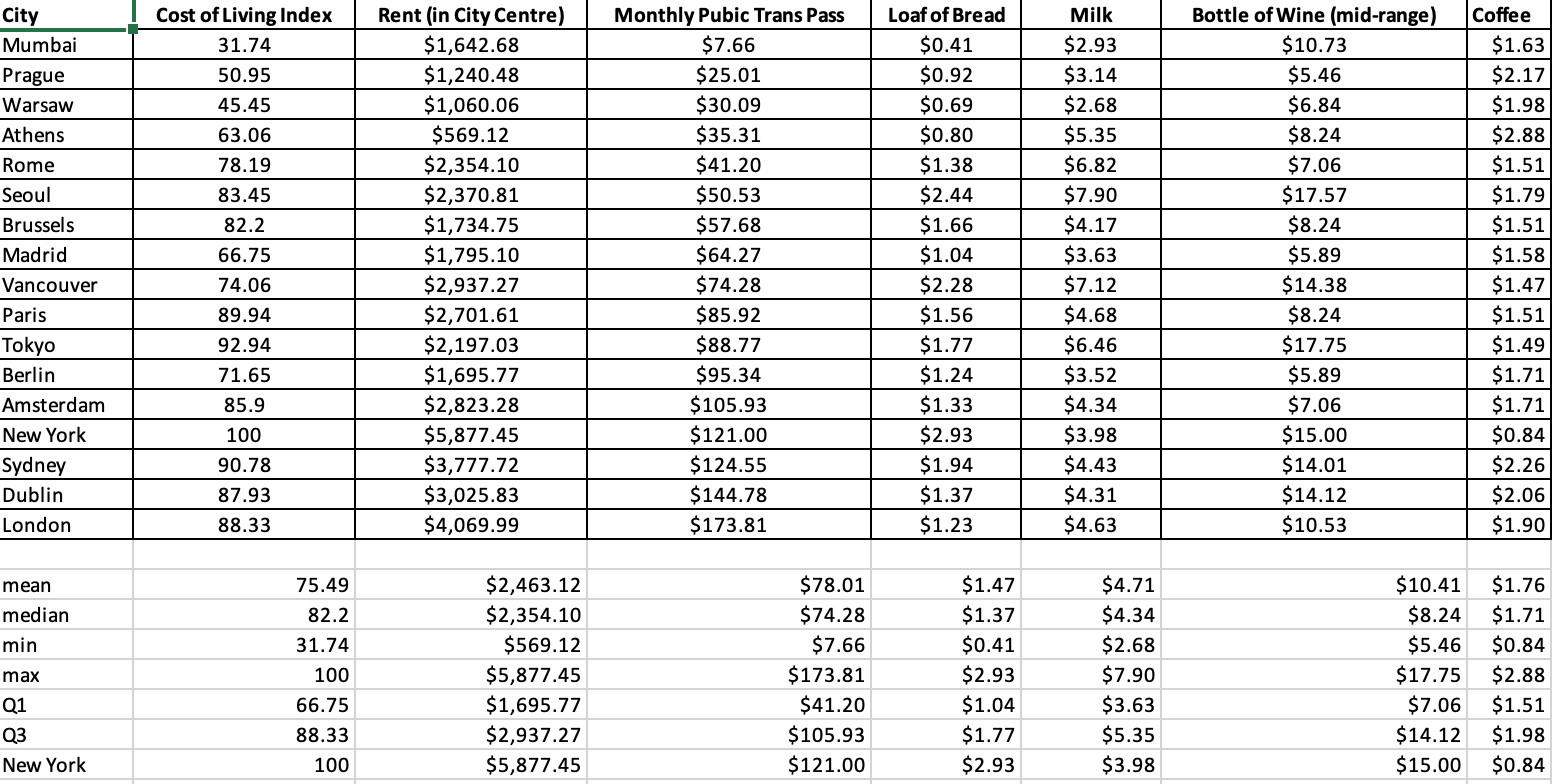
In the Excel document, you will find the 2018 data for 17 cities in the data set Cost of Living. Included are the 2018 cost of living index, cost of a 3-bedroom apartment (per month), price of monthly transportation pass, price of a mid-range bottle of wine, price of a loaf of bread (1 lb.), the price of a gallon of milk and price for a 12 oz. cup of black coffee. All prices are in U.S. dollars.
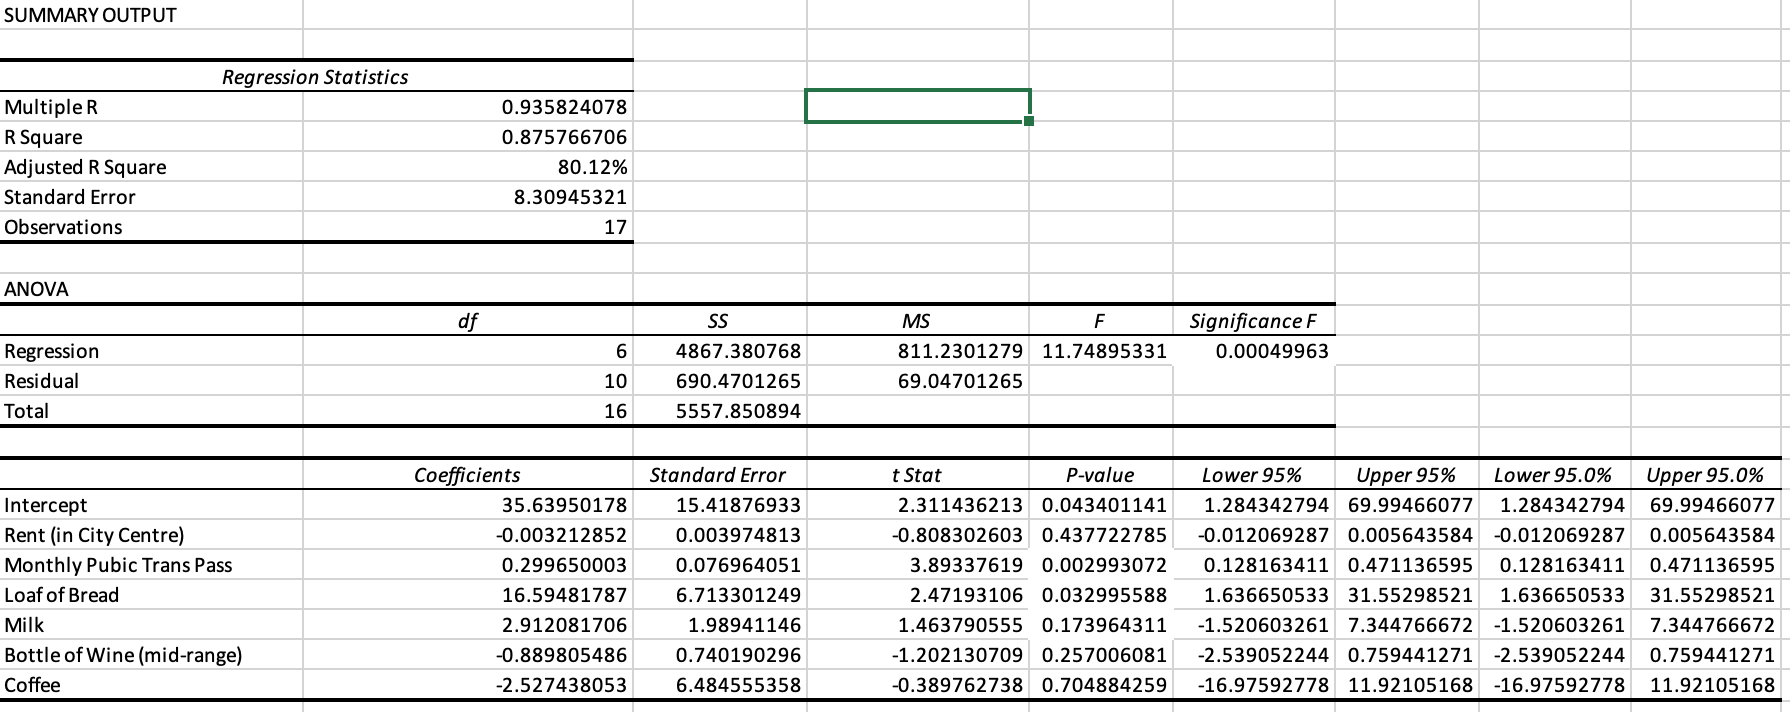
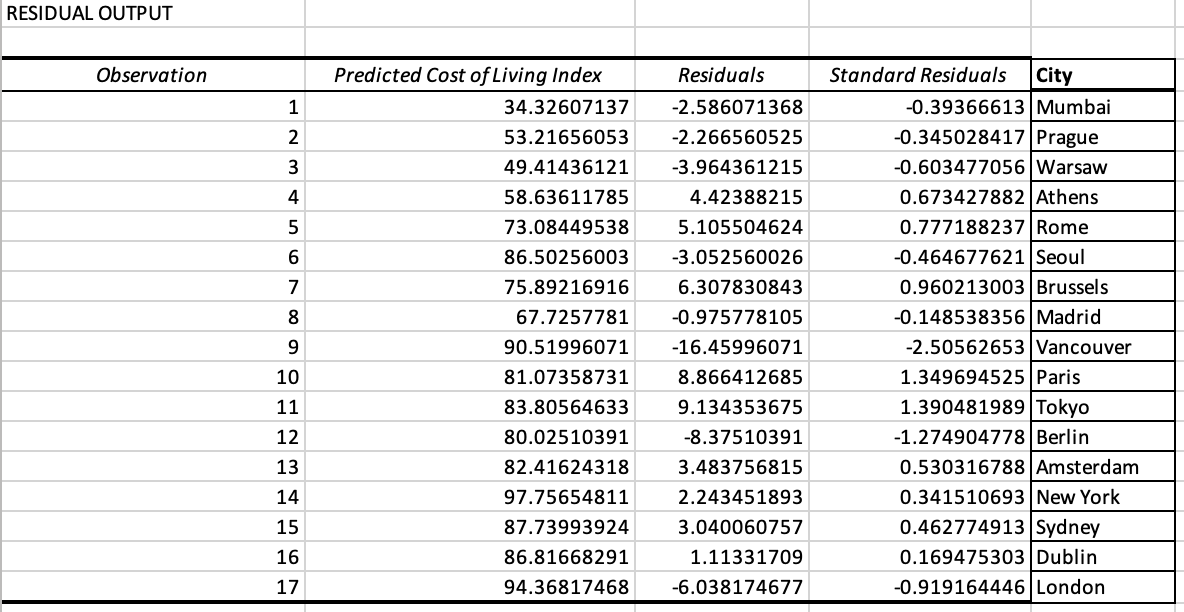
You use this information to run a Multiple Linear Regression to predict Cost of living, along with calculating various descriptive statistics. This is given in the Excel output (that is, the MLR has already been calculated. Your task is to interpret the data).
Based on this information, in which city should you open a second office in? You must justify your answer. If you want to recommend 2 or 3 different cities and rank them based on the data and your findings, this is fine as well.
City Cost of Living Index Rent (in City Centre) Monthly Pubic Trans Pass Loaf of Bread Milk Bottle of Wine (mid-range) Coffee Mumbai 31.74 $1,642.68 $7.66 $0.41 $2.93 $10.73 $1.6 Prague 50.95 $1,240.48 $25.01 $0.92 $3.14 $5.46 $2.17 Warsaw 45.45 $1,060.06 $30.09 $0.69 $2.68 $6.84 $1.98 Athens 63.06 $569.12 $35.31 $0.80 $5.35 $8.24 $2.88 Rome 78.19 $2,354.10 $41.20 $1.38 $6.82 $7.06 $1.51 Seoul 83.45 $2,370.81 $50.53 $2.44 $7.90 $17.57 $1.79 Brussels 82.2 $1,734.75 $57.68 $1.66 $4.17 $8.24 $1.51 Madrid 66.75 $1,795.10 $64.27 $1.04 $3.63 $5.89 $1.58 Vancouver 74.06 $2,937.27 $74.28 $2.28 $7.12 $14.38 $1.47 Paris 89.94 $2,701.61 $85.92 $1.56 $4.68 $8.24 $1.51 Tokyo 92.94 $2,197.03 $88.77 $1.77 $6.46 $17.75 $1.49 Berlin 71.65 $1,695.77 $95.34 $1.24 $3.52 $5.89 $1.71 Amsterdam 85.9 $2,823.28 $105.93 $1.33 $4.34 $7.06 $1.71 New York 100 $5,877.45 $121.00 $2.93 $3.98 $15.00 $0.84 Sydney 90.78 $3,777.72 $124.55 $1.94 $4.43 $14.01 $2.26 Dublin 87.93 $3,025.83 $144.78 $1.37 $4.31 $14.12 $2.06 London 88.33 $4,069.99 $173.81 $1.23 $4.63 $10.53 $1.90 mean 75.49 $2,463.12 $78.01 $1.47 $4.71 $10.41 $1.76 median 82.2 $2,354.10 $74.28 $1.37 $4.34 $8.24 $1.71 min 31.74 $569.12 $7.66 $0.41 $2.68 $5.46 $0.84 max 100 $5,877.45 $173.81 $2.93 $7.90 $17.75 $2.88 Q1 66.75 $1,695.77 $41.20 $1.04 $3.63 $7.06 $1.51 Q3 88.33 $2,937.27 $105.93 $1.77 $5.35 $14.12 $1.98 New York 100 $5,877.45 $121.00 $2.93 $3.98 $15.00 $0.84SUMMARY OUTPUT Regression Statistics Multiple R 0.935824078 R Square 0.875766706 Adjusted R Square 80.12% Standard Error 8.30945321 Observations 17 ANOVA df SS MS F Significance F Regression 6 4867.380768 811.2301279 11.74895331 0.00049963 Residual 10 690.4701265 69.04701265 Total 16 5557.850894 Coefficients Standard Error t Stat P-value Lower 95% Upper 95% Lower 95.0% Upper 95.0% Intercept 35.63950178 15.41876933 2.311436213 0.043401141 1.284342794 69.99466077 1.284342794 69.99466077 Rent (in City Centre) -0.003212852 0.003974813 -0.808302603 0.437722785 -0.012069287 0.005643584 -0.012069287 0.005643584 Monthly Pubic Trans Pass 0.299650003 0.076964051 3.89337619 0.002993072 0.128163411 0.471136595 0.128163411 0.471136595 Loaf of Bread 16.59481787 6.713301249 2.47193106 0.032995588 1.636650533 31.55298521 1.636650533 31.55298521 Milk 2.912081706 1.98941146 1.463790555 0.173964311 -1.520603261 7.344766672 -1.520603261 7.344766672 Bottle of Wine (mid-range) -0.889805486 0.740190296 -1.202130709 0.257006081 -2.539052244 0.759441271 -2.539052244 0.759441271 Coffee -2.527438053 6.484555358 -0.389762738 0.704884259 -16.97592778 11.92105168 -16.97592778 11.92105168RESIDUAL OUTPUT Observation Predicted Cost of Living Index Residuals Standard Residuals City 1 34.32607137 -2.586071368 0.39366613 Mumbai 2 53.21656053 -2.266560525 -0.345028417 Prague 3 49.41436121 -3.964361215 -0.603477056 Warsaw 4 58.63611785 4.42388215 0.673427882 Athens 73.08449538 5.105504624 0.777188237 Rome 86.50256003 -3.052560026 -0.464677621 Seoul 75.89216916 6.307830843 0.960213003 Brussels 8 67.7257781 -0.975778105 -0.148538356 Madrid 9 90.51996071 -16.45996071 -2.50562653 Vancouver 10 81.07358731 8.866412685 1.349694525 Paris 11 83.80564633 9.134353675 1.390481989 Tokyo 12 80.02510391 -8.37510391 -1.274904778 Berlin 13 82.41624318 3.483756815 0.530316788 Amsterdam 14 97.75654811 2.243451893 0.341510693 New York 15 87.73993924 3.040060757 0.462774913 Sydney 16 86.81668291 1.11331709 0.169475303 Dublin 17 94.36817468 -6.038174677 -0.919164446 London