Answered step by step
Verified Expert Solution
Link Copied!

Question

1 Approved Answer

In the excel file, you have 25 comparable companies along with information on P/E ratio, expected growth in EPS, regression beta, and payout ratio. Assuming

In the excel file, you have 25 comparable companies along with information on P/E ratio, expected growth in EPS, regression beta, and payout ratio. Assuming that P/E is modeled as a linear function of the three latter variables and using regression estimates based on the data, answer the following questions.

Q2 (5 points):

What is the coefficient estimate on payout ratio?

Answer:

Q3 (5 points):

Is the sign of coefficient on beta aligned with what you would generally expect from a theoretical perspective (Yes/No)?

Answer:

Q4 (5 points):

How many of the companies (out of 25) in the list are undervalued based on your predicted value of P/E ratio (using all of the variables in the regression (and including regression constant) regardless of statistical significance).

Answer:

Q5 (5 points):

Which company is the most undervalued based on your calculations in Q4?

Answer:
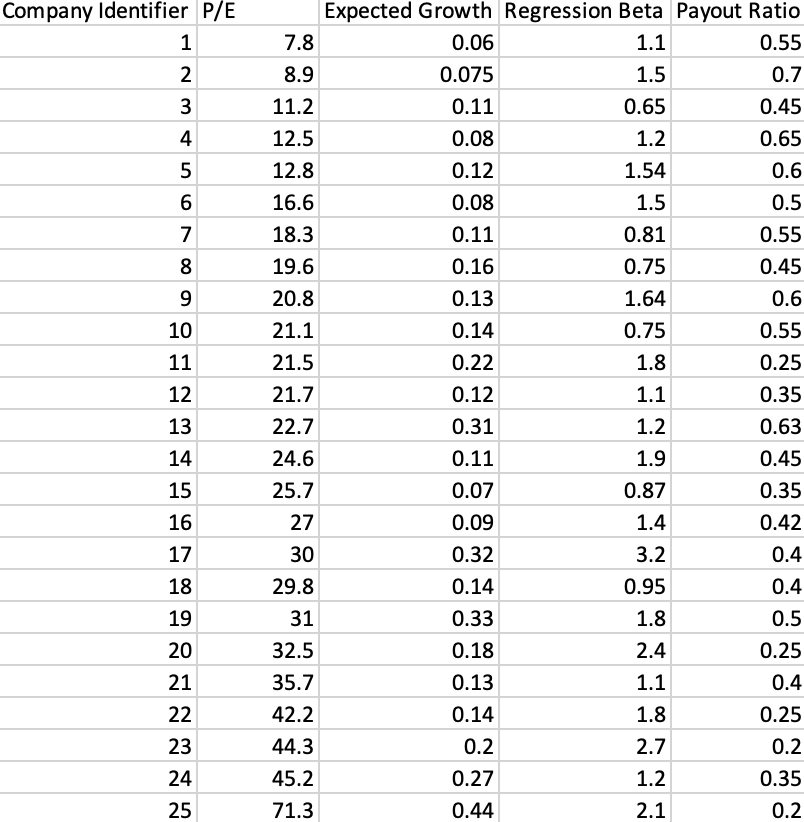
image text in transcribed

Company Identifier P/E Expected Growth Regression Beta Payout Ratio 7.8 0.06 1.1 0.55 NP 8.9 0.075 1.5 0.7 3 11.2 0.11 0.65 0.45 3 4 4 12.5 0.08 1.2 0.65 5 12.8 0.12 1.54 0.6 6 16.6 0.08 1.5 0.5 7 18.3 0.11 0.81 0.55 8 19.6 0.16 0.75 0.45 9 20.8 0.13 1.64 0.6 10 21.1 0.14 0.75 0.55 11 21.5 0.22 1.8 0.25 12 21.7 0.12 1.1 0.35 13 22.7 0.31 1.2 0.63 14 24.6 0.11 1.9 0.45 15 25.7 0.07 0.87 0.35 16 27 0.09 1.4 0.42 17 30 0.32 3.2 0.4 18 29.8 0.14 0.95 0.4 19 31 0.33 1.8 0.5 20 32.5 0.18 2.4 0.25 21 35.7 0.13 1.1 0.4 22 42.2 0.14 1.8 0.25 23 44.3 0.2 2.7 0.2 24 45.2 0.27 1.2 0.35 25 71.3 0.44 2.1 0.2 Company Identifier P/E Expected Growth Regression Beta Payout Ratio 7.8 0.06 1.1 0.55 NP 8.9 0.075 1.5 0.7 3 11.2 0.11 0.65 0.45 3 4 4 12.5 0.08 1.2 0.65 5 12.8 0.12 1.54 0.6 6 16.6 0.08 1.5 0.5 7 18.3 0.11 0.81 0.55 8 19.6 0.16 0.75 0.45 9 20.8 0.13 1.64 0.6 10 21.1 0.14 0.75 0.55 11 21.5 0.22 1.8 0.25 12 21.7 0.12 1.1 0.35 13 22.7 0.31 1.2 0.63 14 24.6 0.11 1.9 0.45 15 25.7 0.07 0.87 0.35 16 27 0.09 1.4 0.42 17 30 0.32 3.2 0.4 18 29.8 0.14 0.95 0.4 19 31 0.33 1.8 0.5 20 32.5 0.18 2.4 0.25 21 35.7 0.13 1.1 0.4 22 42.2 0.14 1.8 0.25 23 44.3 0.2 2.7 0.2 24 45.2 0.27 1.2 0.35 25 71.3 0.44 2.1 0.2

Step by Step Solution

There are 3 Steps involved in it

Step: 1

blur-text-image

Get Instant Access to Expert-Tailored Solutions

See step-by-step solutions with expert insights and AI powered tools for academic success

Step: 2

blur-text-image_2

Step: 3

blur-text-image_3

Ace Your Homework with AI

Get the answers you need in no time with our AI-driven, step-by-step assistance

Get Started

Recommended Textbook for

Capital Flows Financial Markets And Banking Crises

Authors: Chia-Ying Chang

1st Edition

0415749557, 978-0415749558

More Books

Students also viewed these Finance questions