

Question
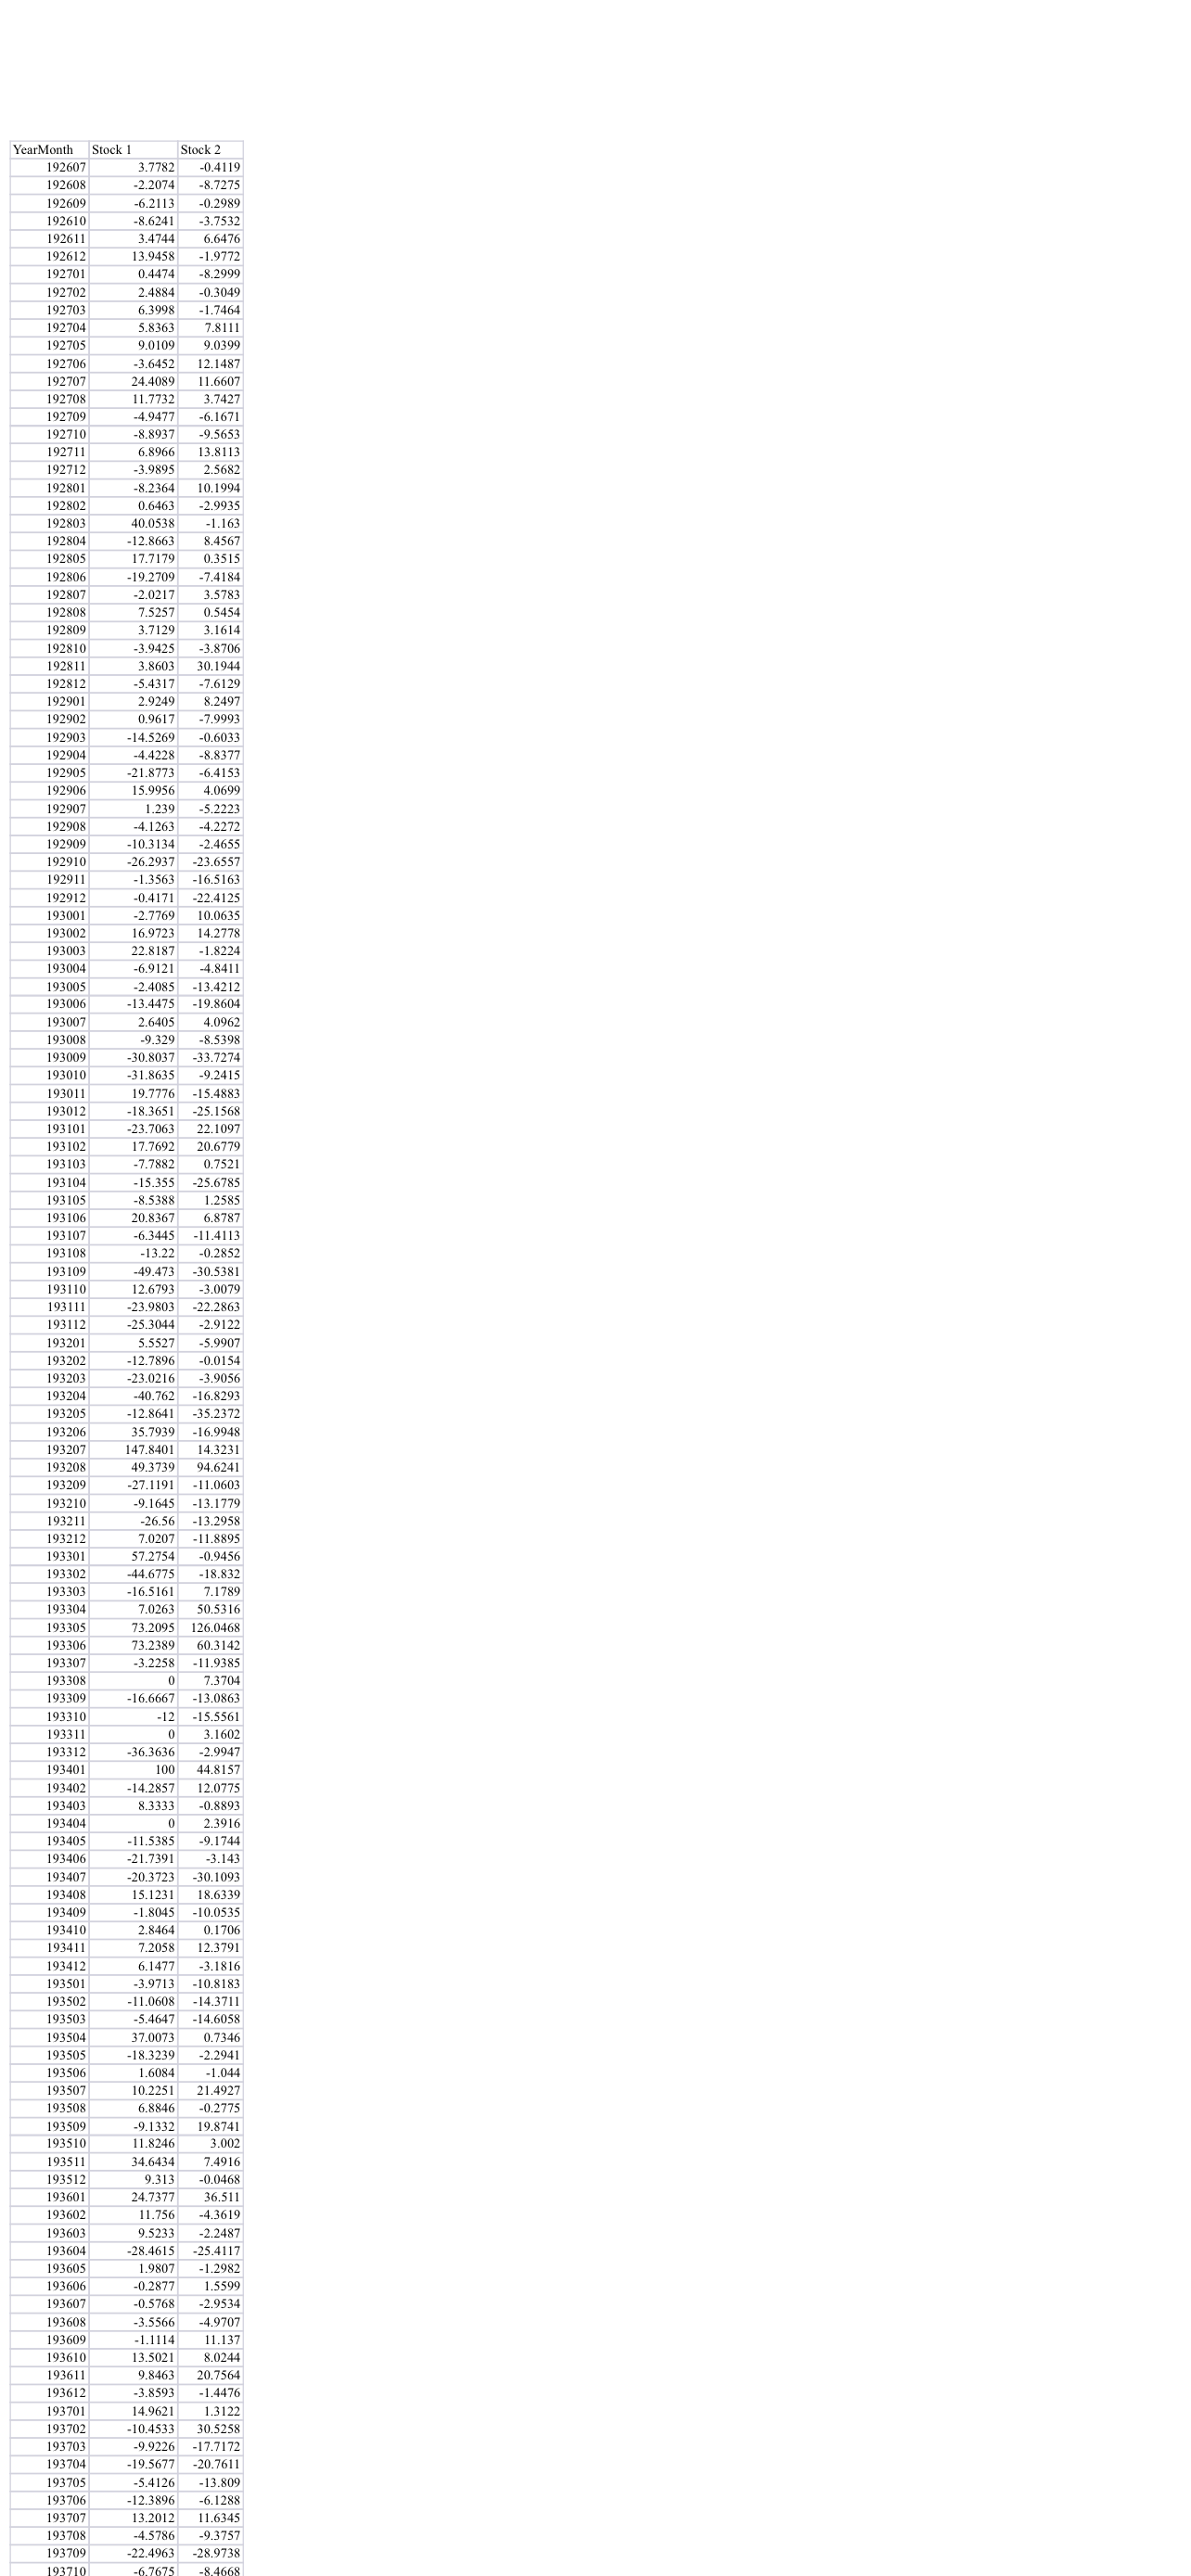
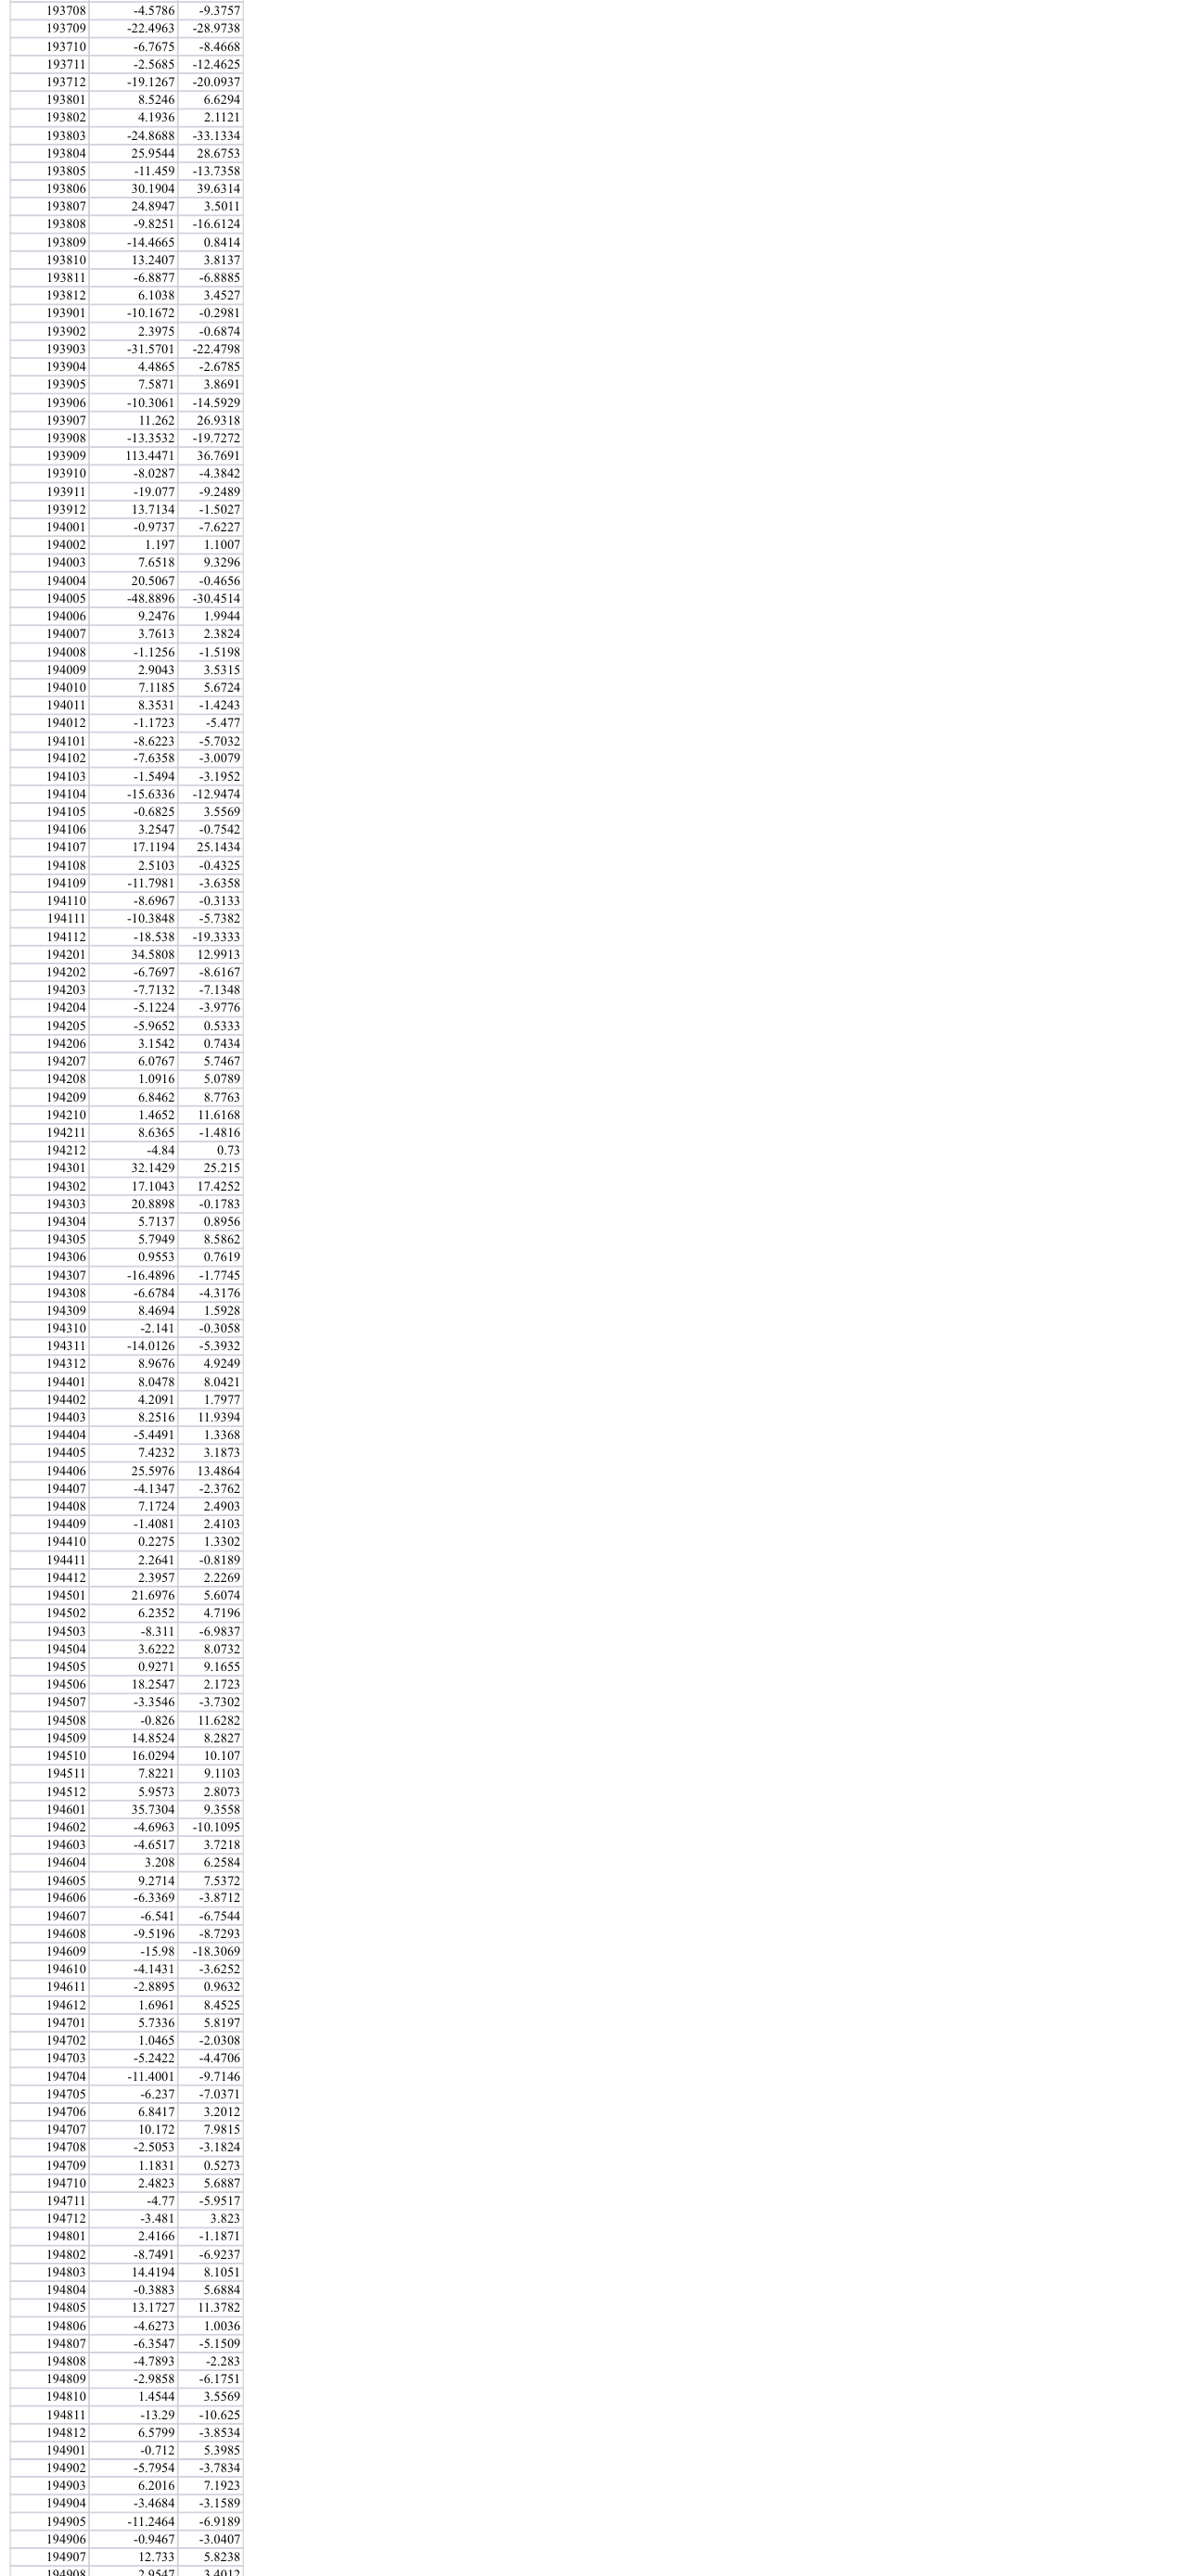
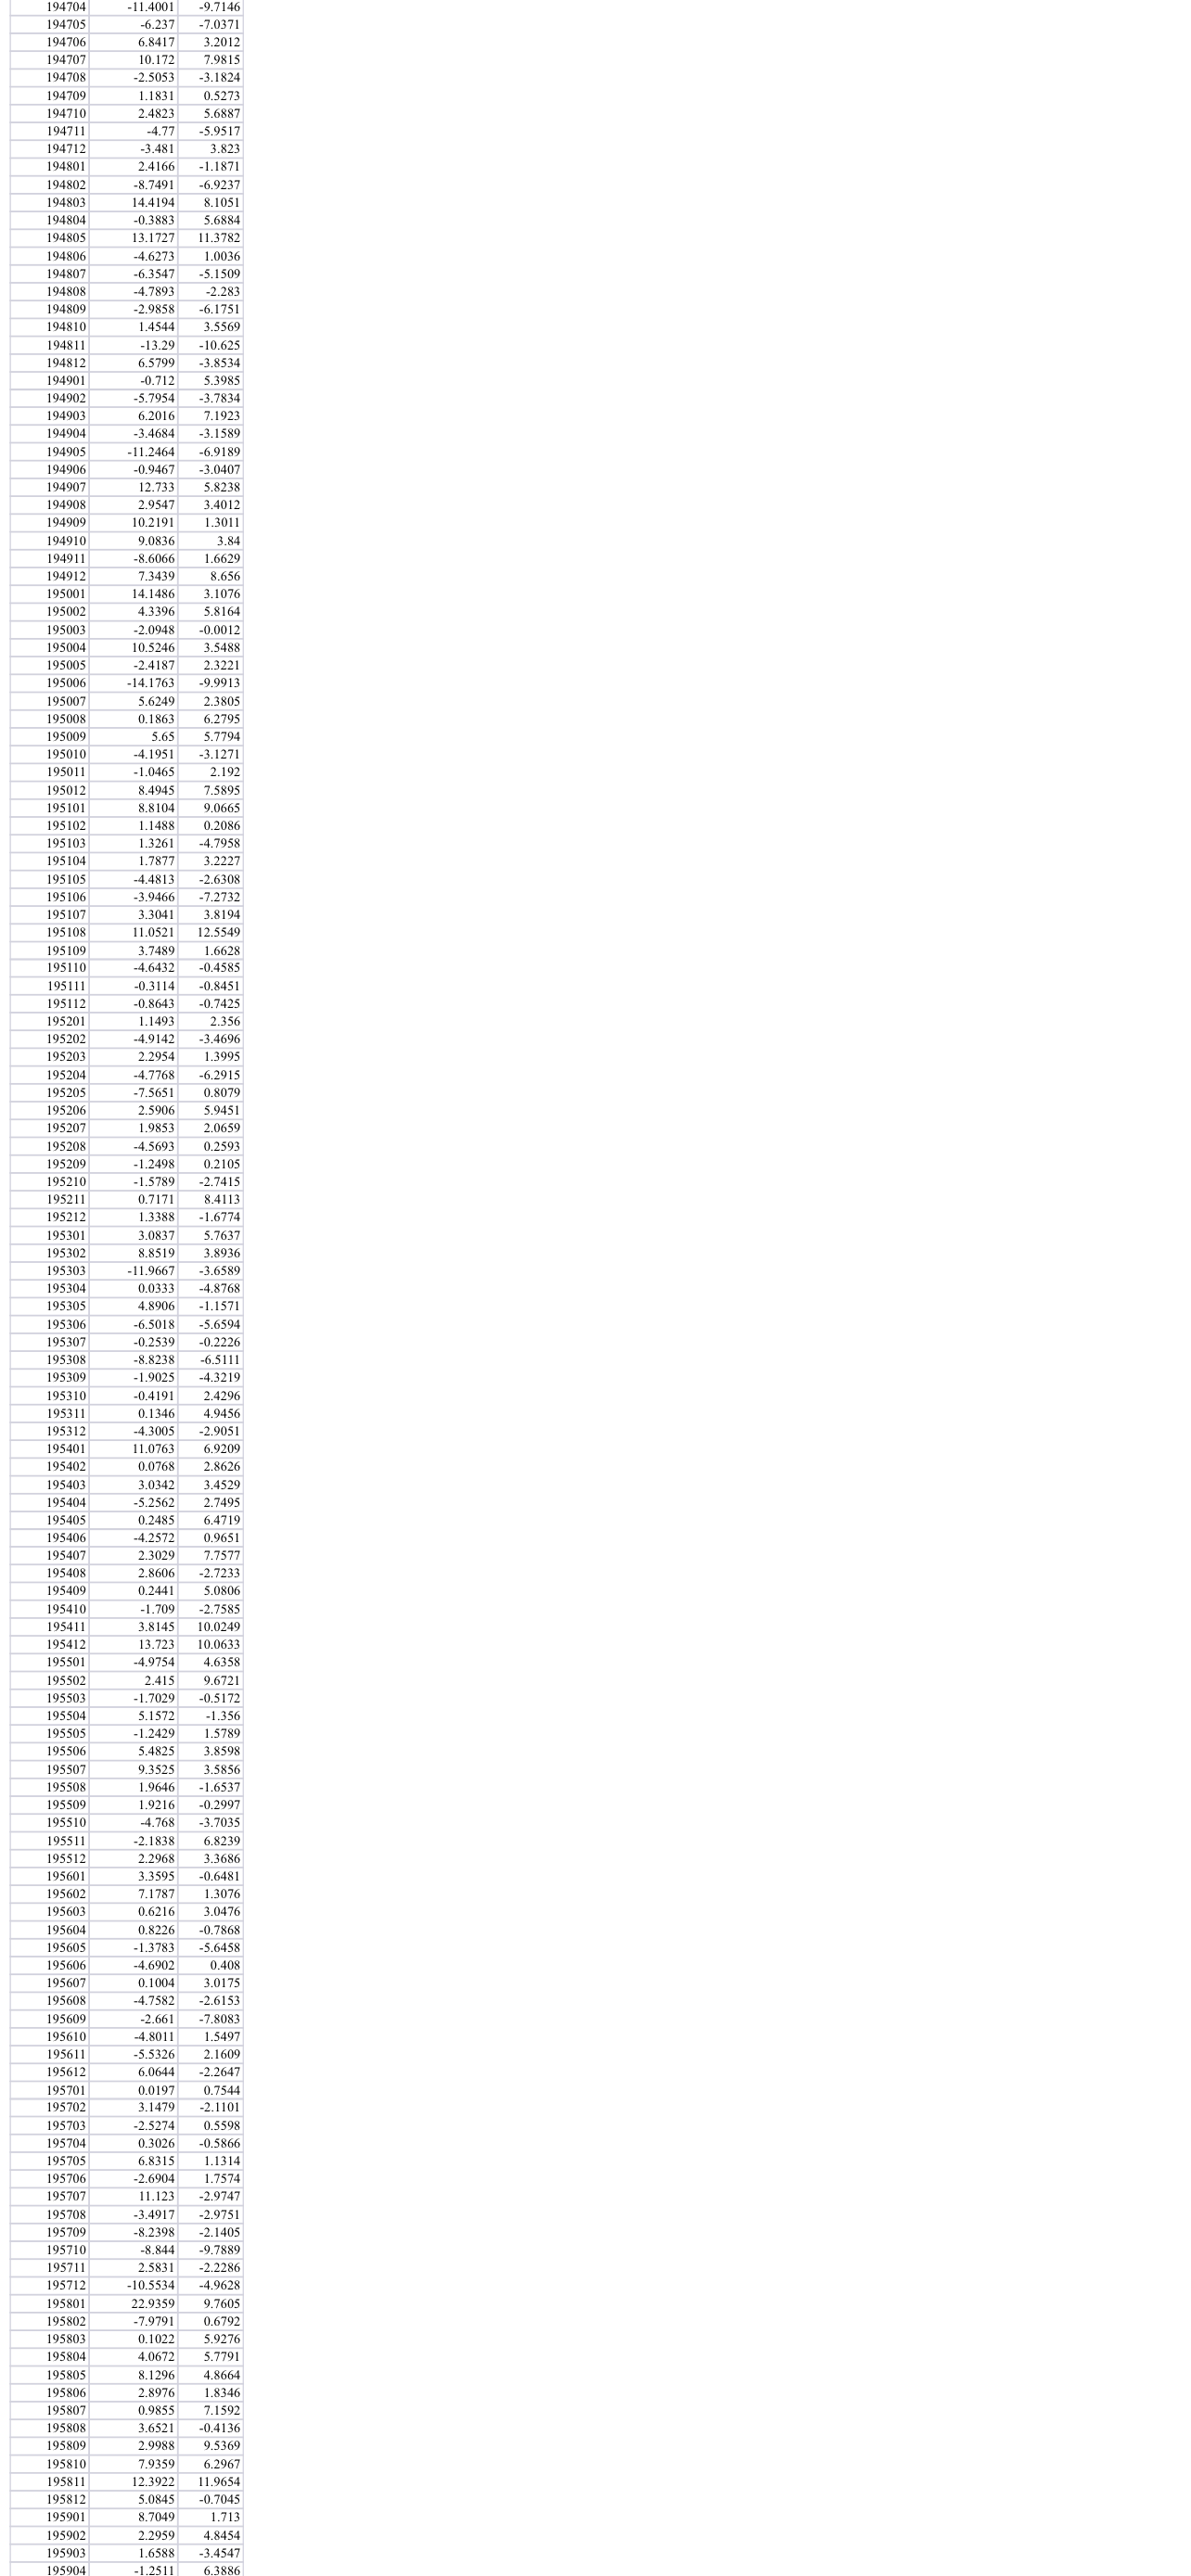
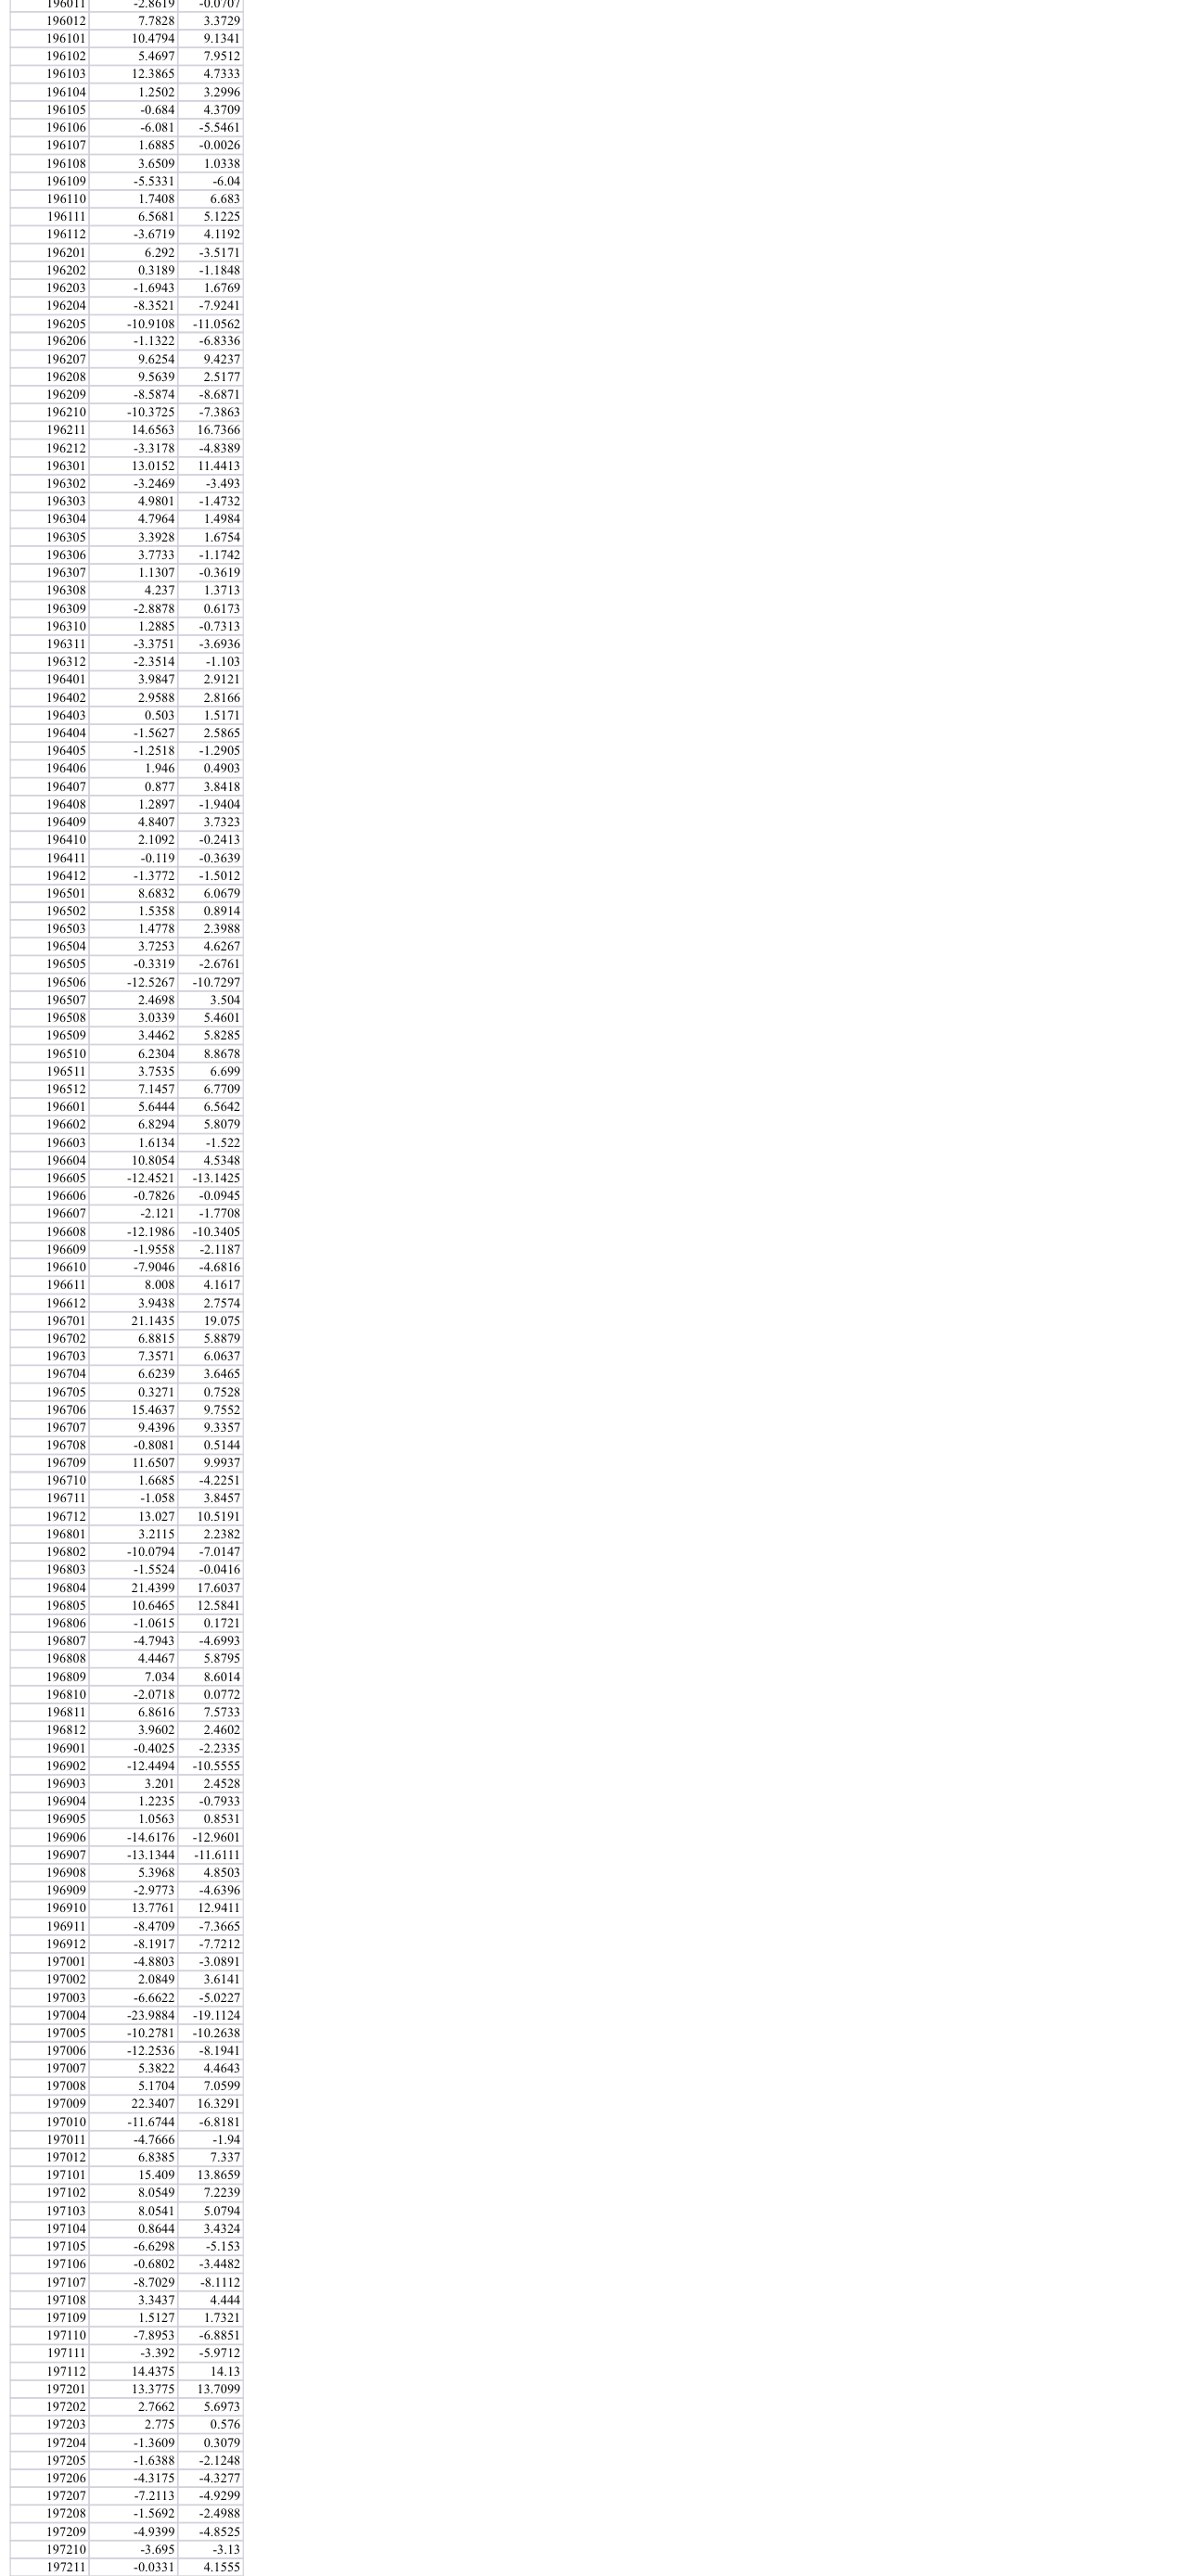
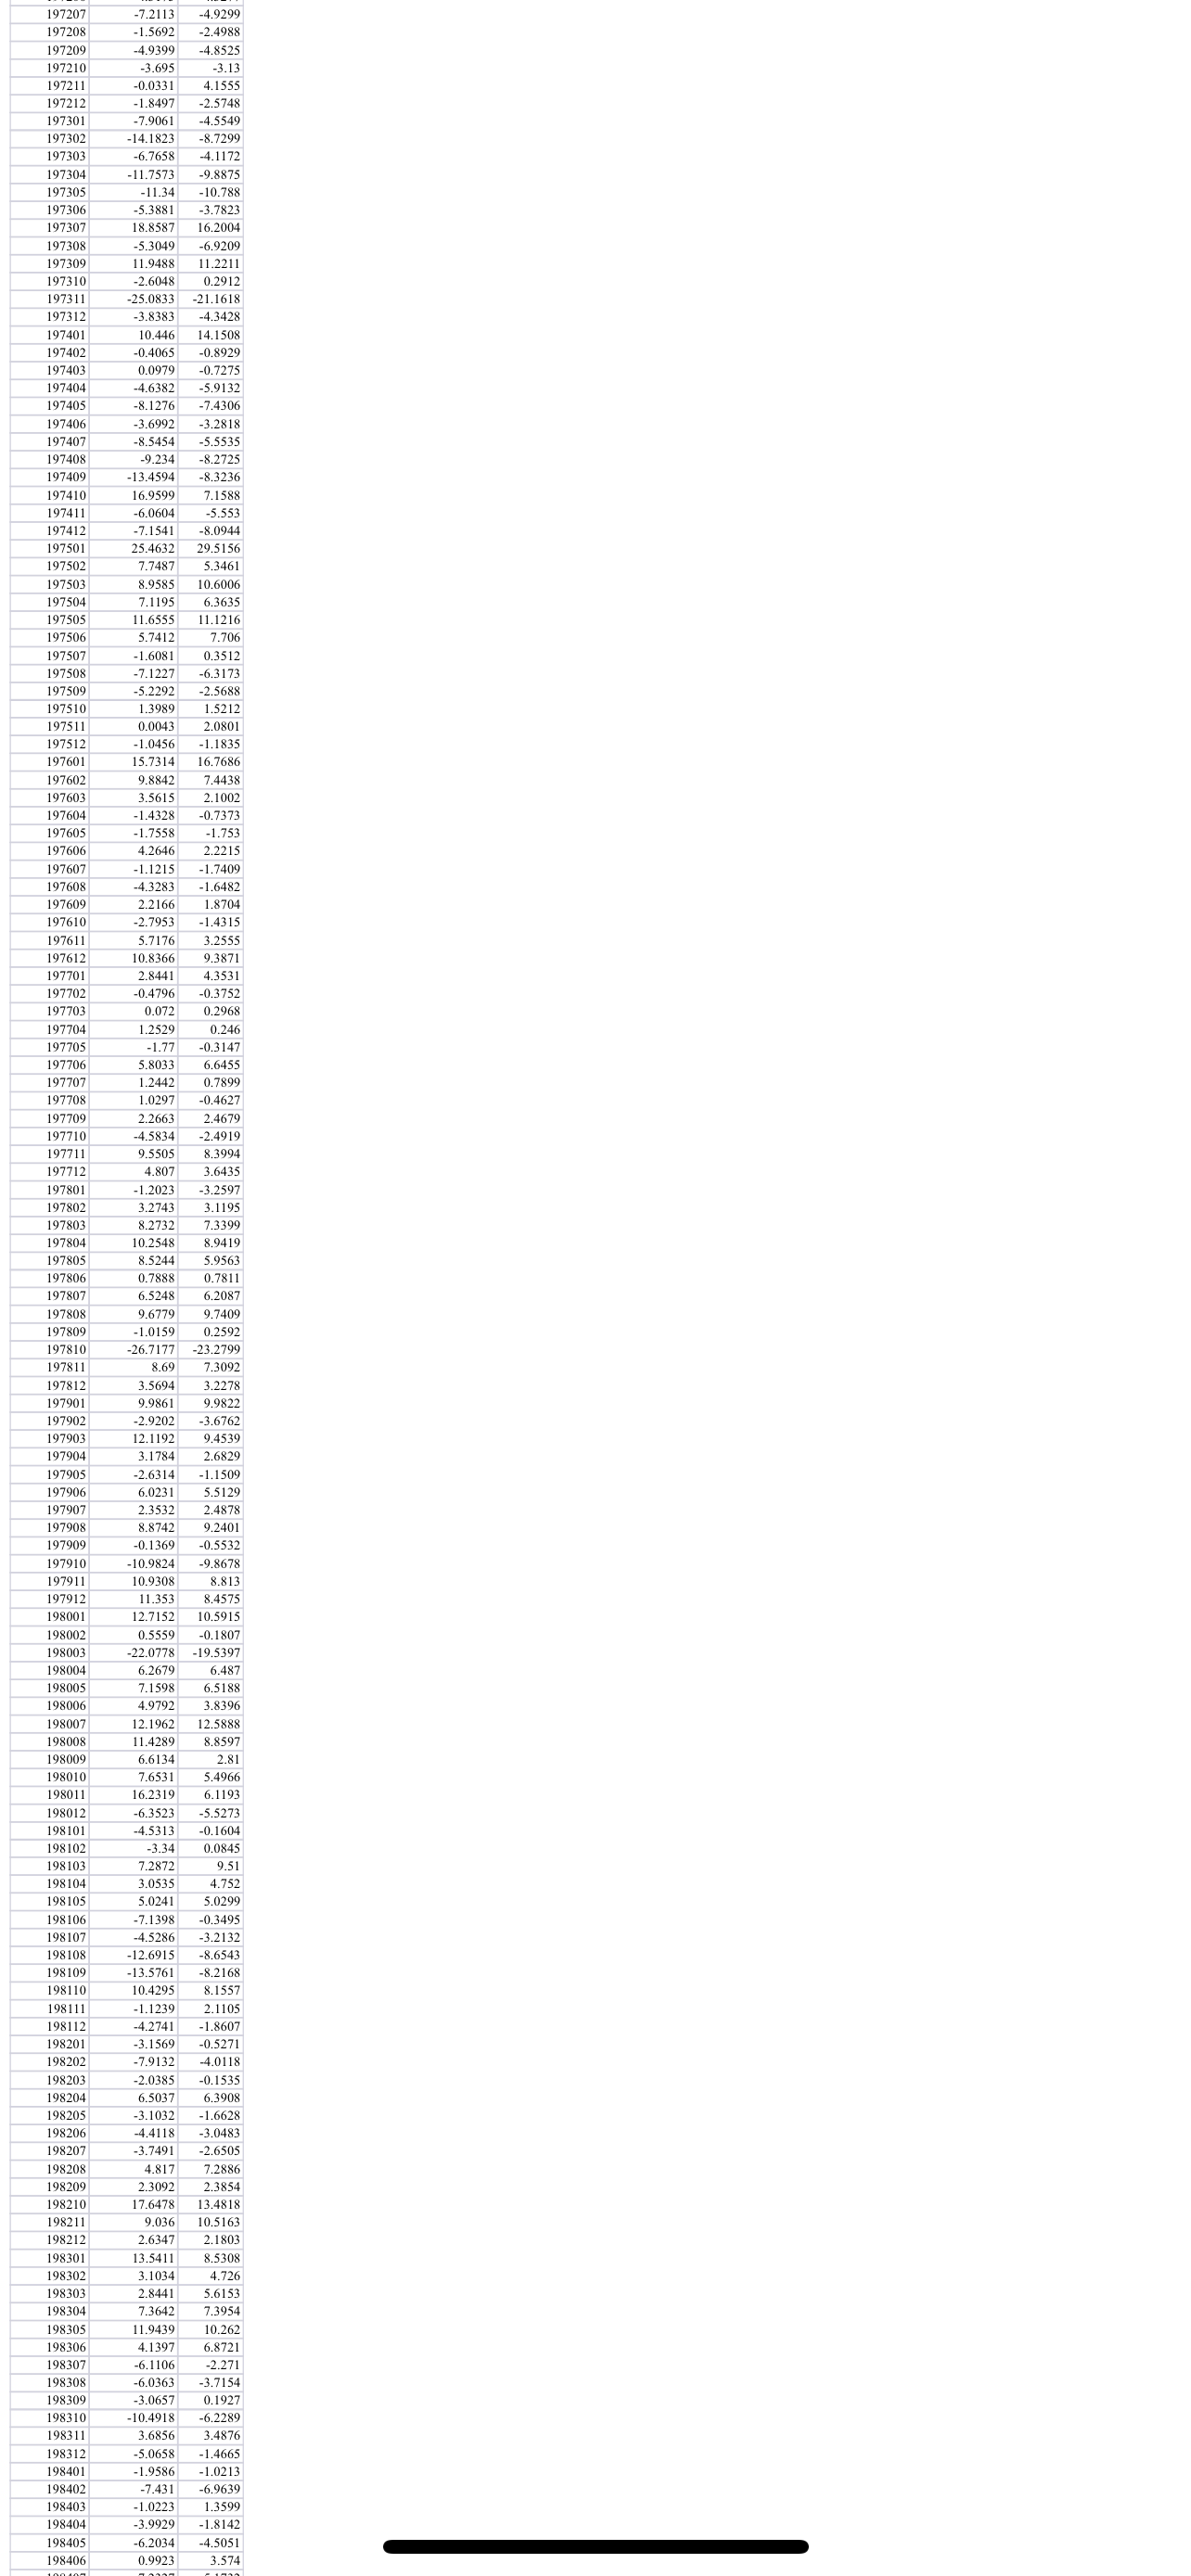
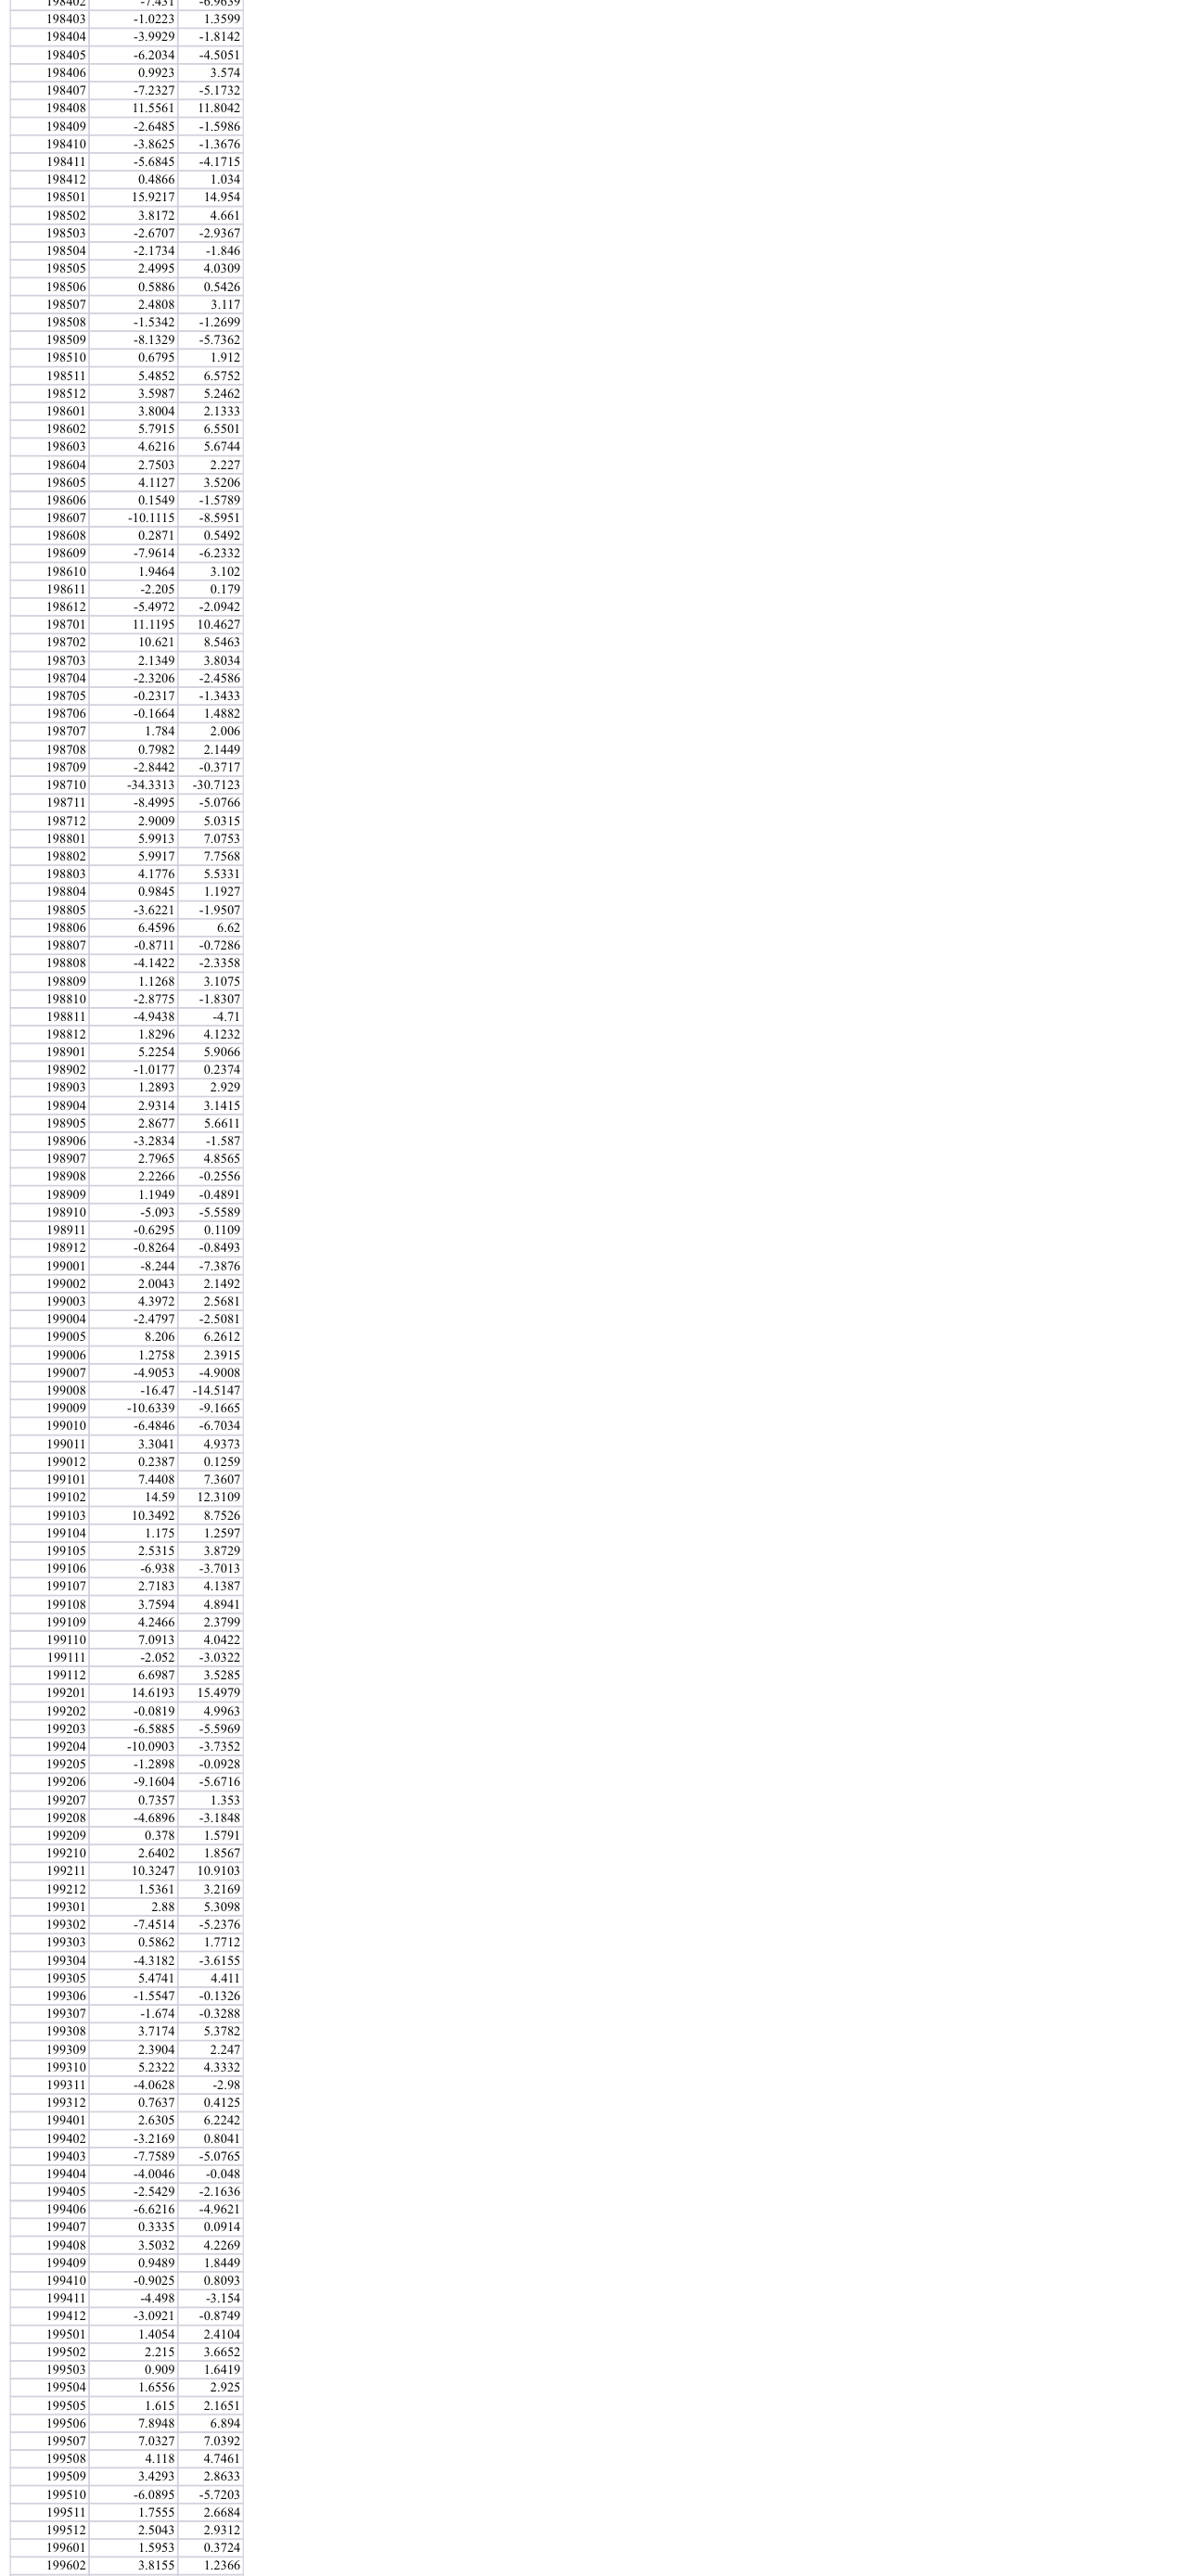
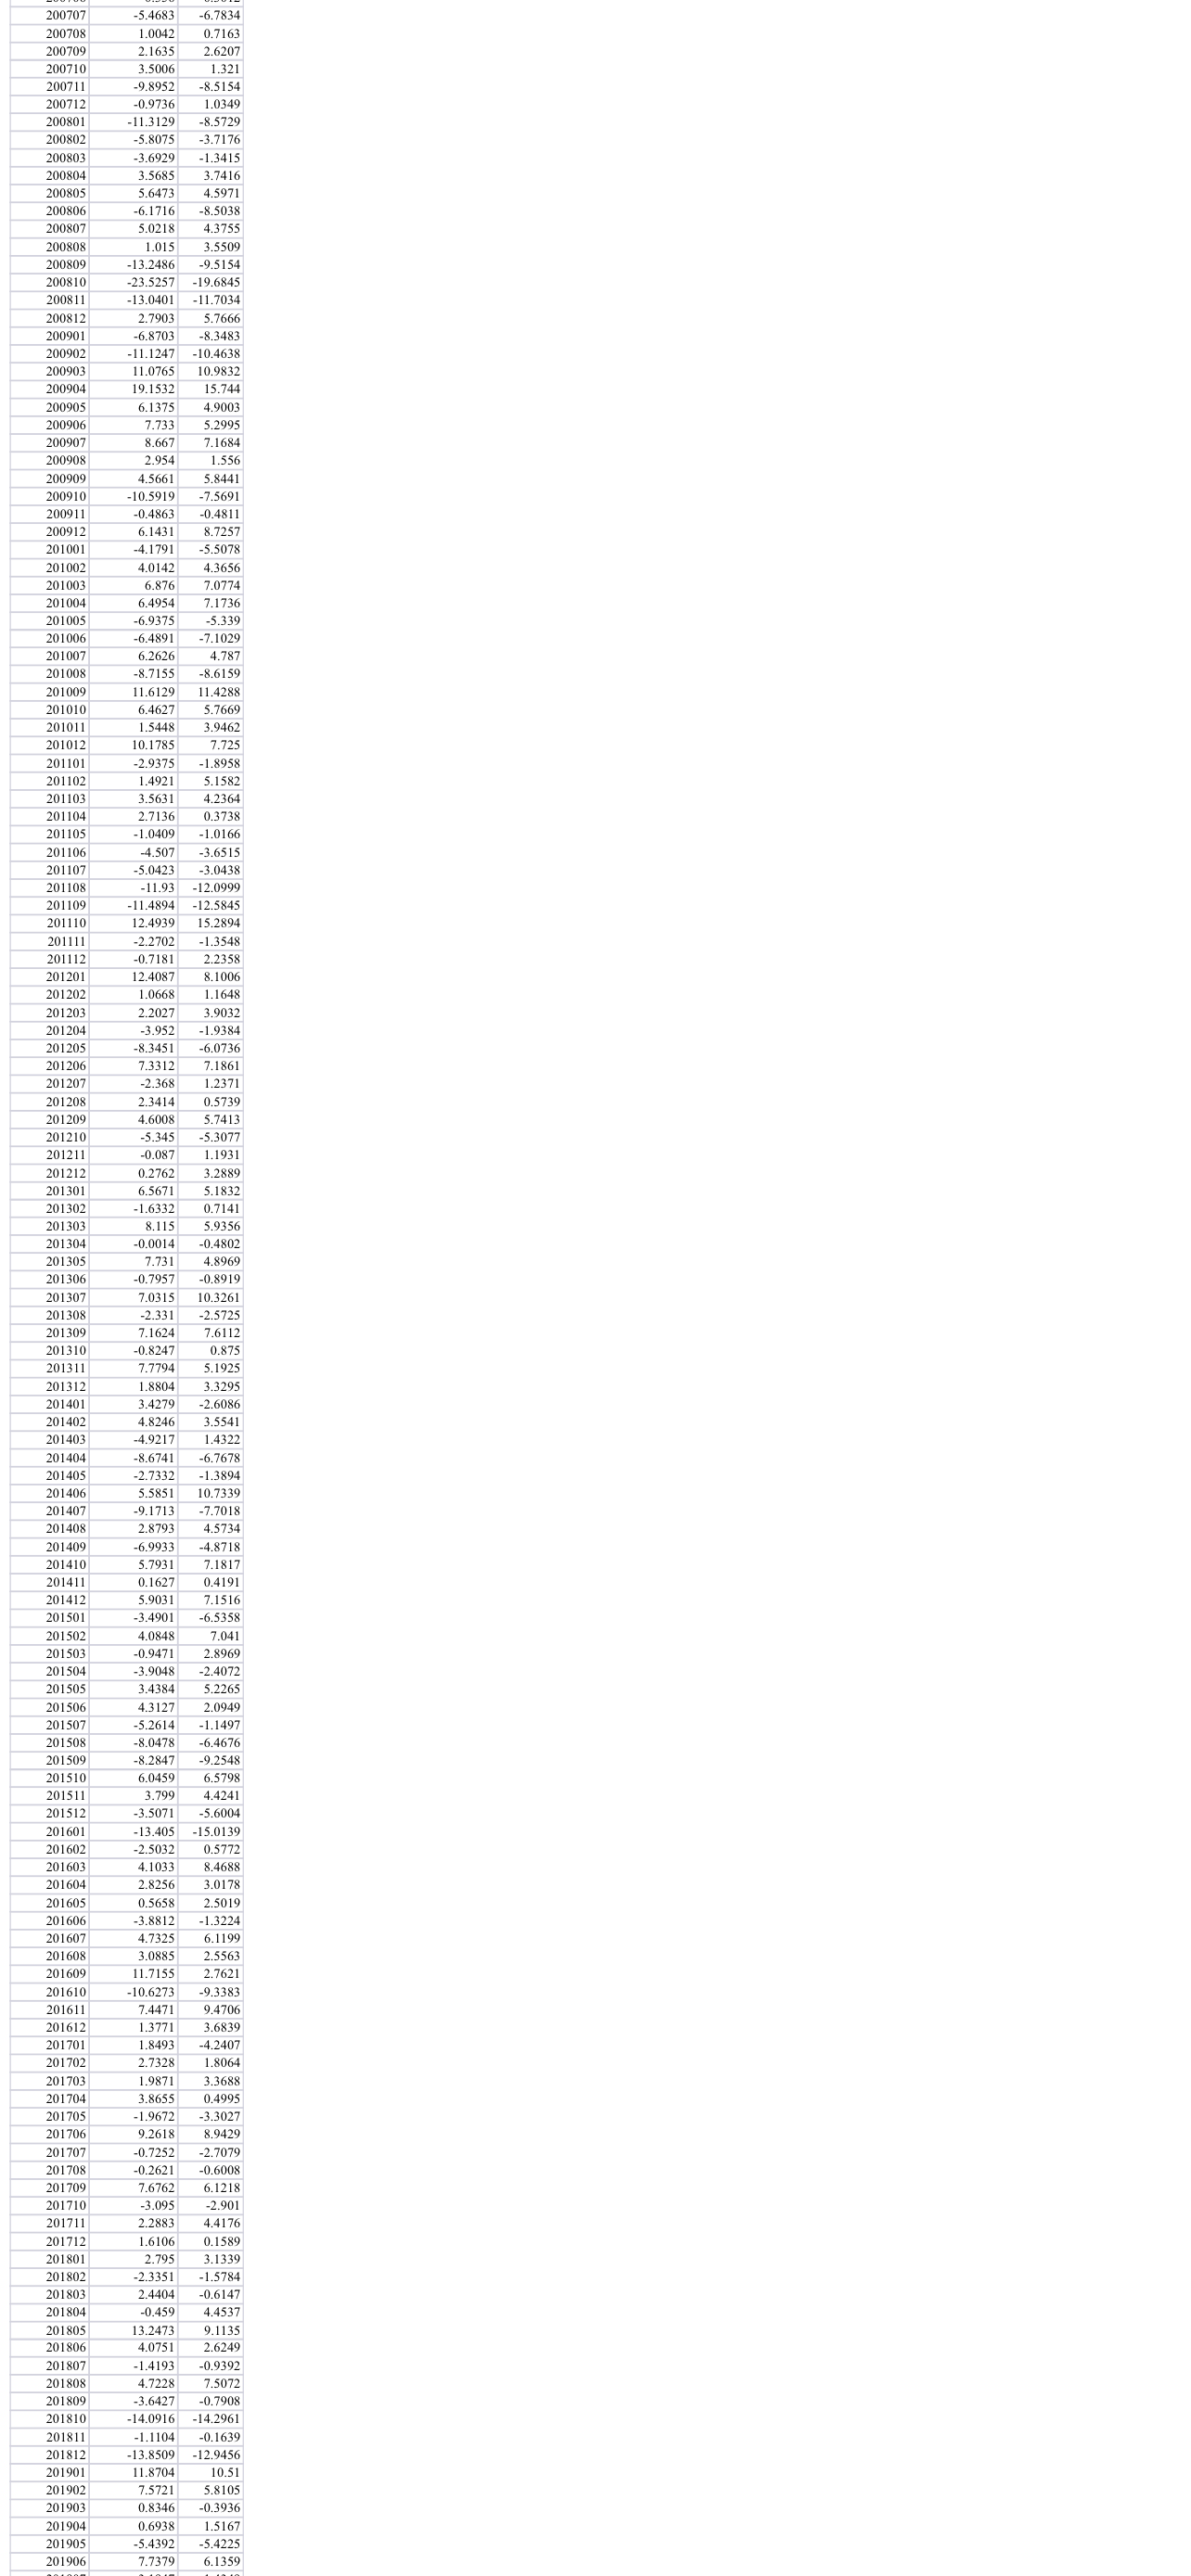
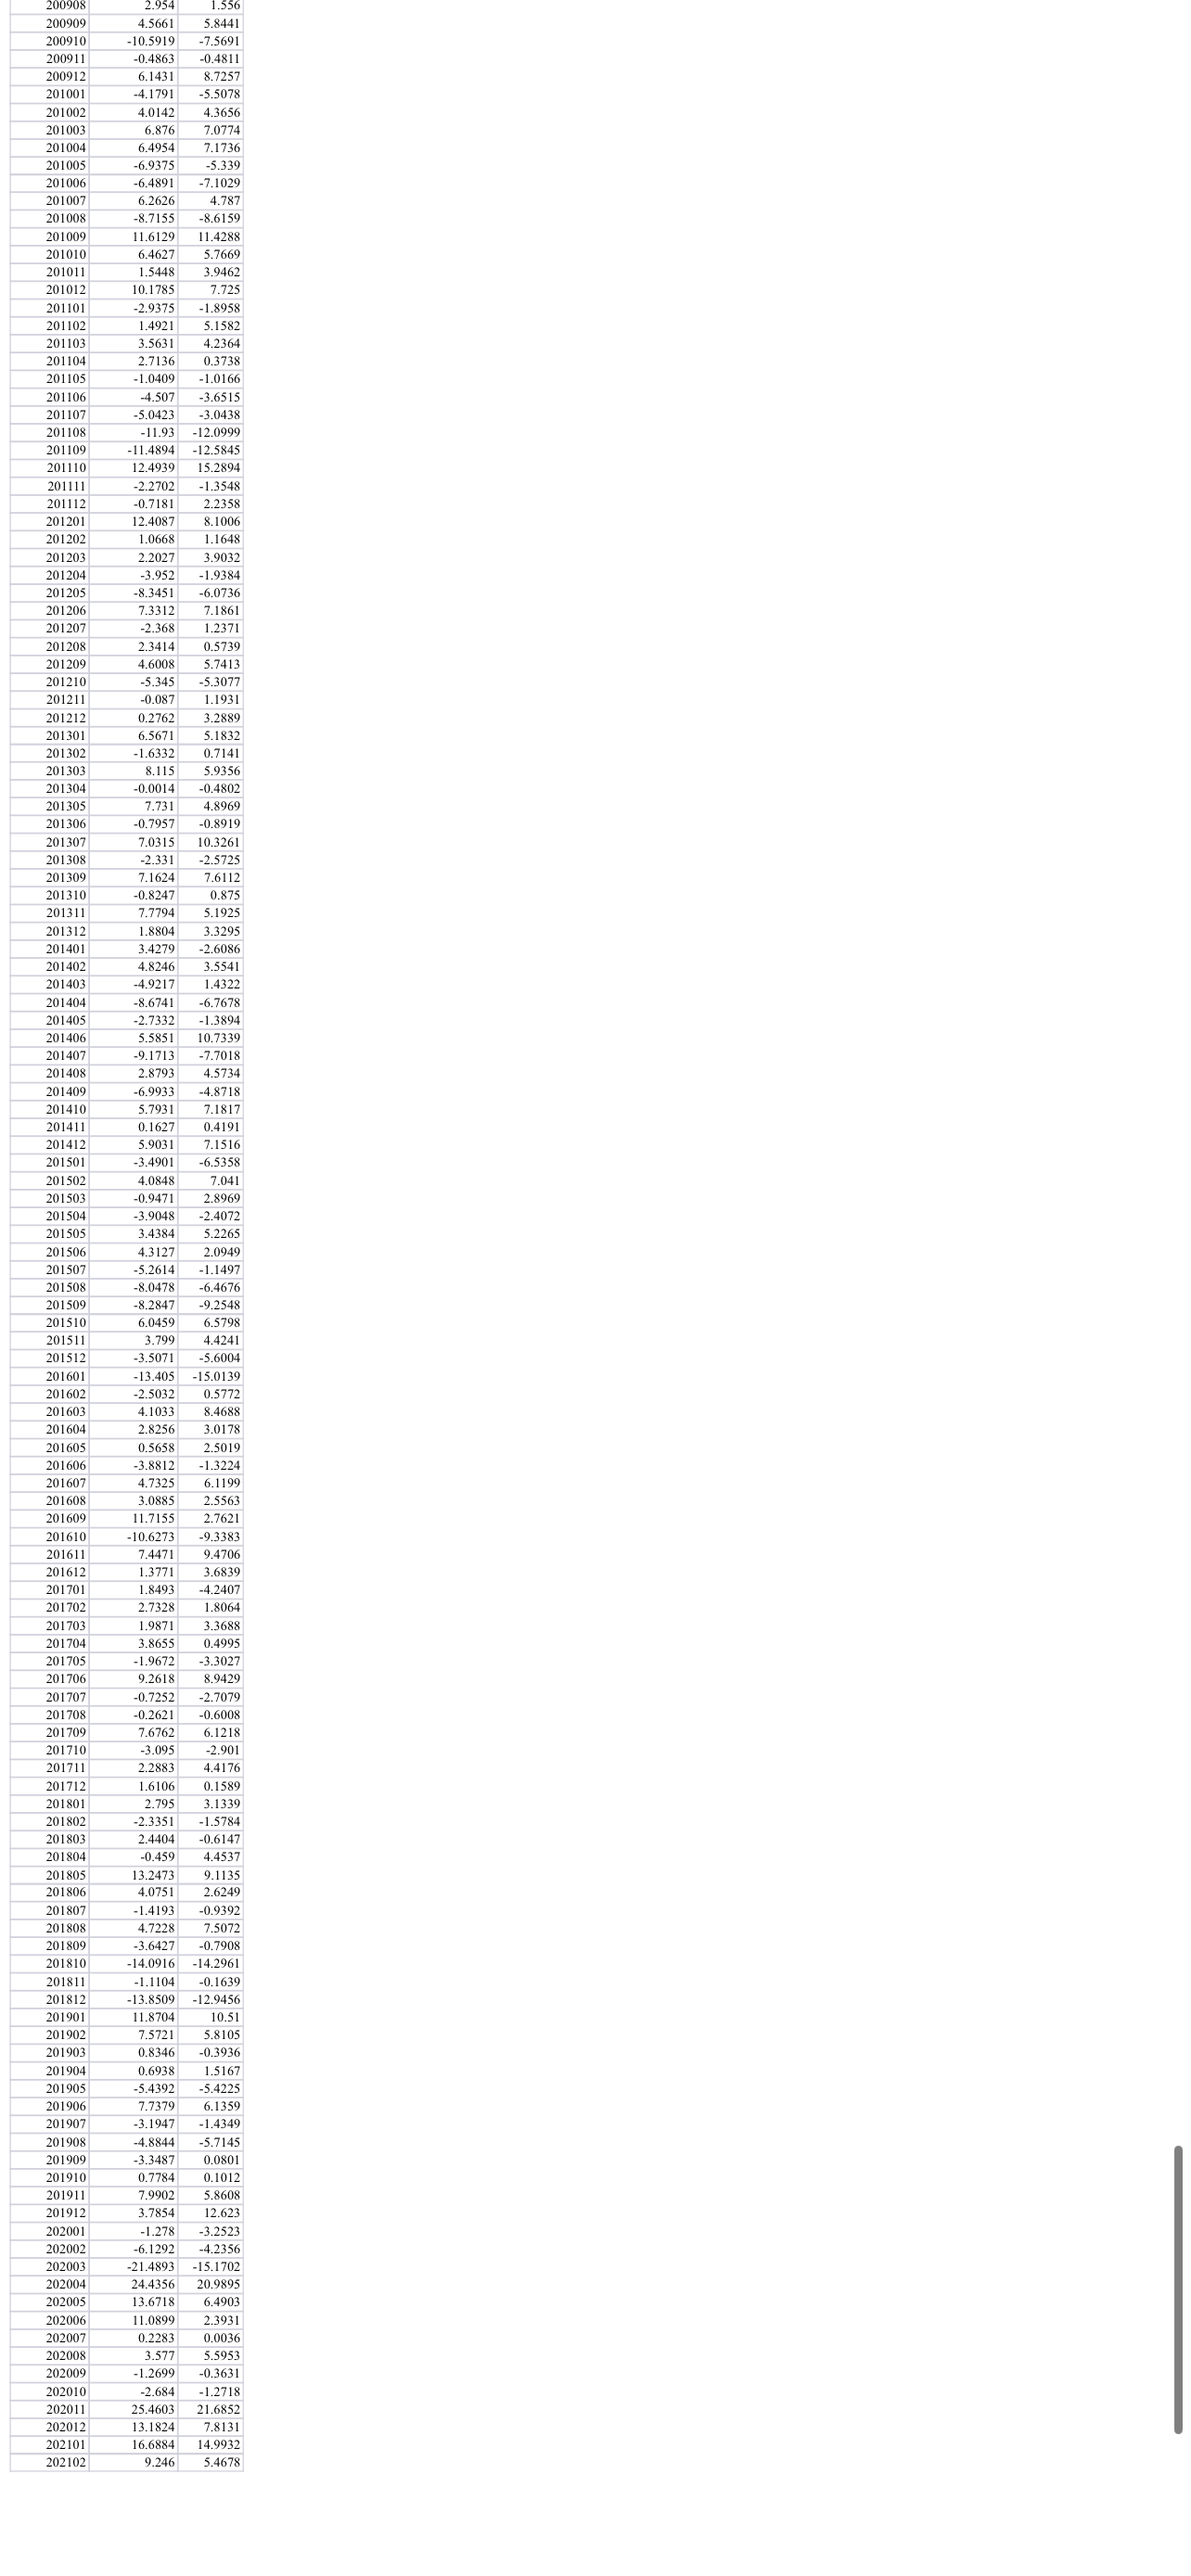
In the excel sheet you will see 3 columns - YearMonth, Stock 1 and Stock 2. The number are returns (3.7782 for instance means 3.7782%).
In the excel sheet you will see 3 columns - YearMonth, Stock 1 and Stock 2. The number are returns (3.7782 for instance means 3.7782%). Report if following:
1. What is the average return on Stock 1 and Stock 2?
2. What is the standard deviation of Stock 1 and Stock 2?
3. What is the correlation between the two Stocks?
Next you are going to consider a portfolio consisting of a fraction w1 in stock 1 and w2 = 1-w1 in stock 2
Use the results above to calculate the average return and standard deviation of the portfolio when varying w1 between 0 and 4. What is the minim variance portfolio?
Consider a risk-free rate of 1% and assume that you can invest/borrow at the same rate.
5. Draw the efficient frontier when you can invest/borrow in the risk-free rate in addition to the two stocks above. Below is the Excel data.

Step by Step Solution
There are 3 Steps involved in it
Step: 1

Get Instant Access to Expert-Tailored Solutions
See step-by-step solutions with expert insights and AI powered tools for academic success
Step: 2

Step: 3
Ace Your Homework with AI
Get the answers you need in no time with our AI-driven, step-by-step assistance
Get Started
Derivatives Markets
Authors: Rober L. Macdonald
4th edition
321543084, 978-0321543080