Answered step by step
Verified Expert Solution
Question
1 Approved Answer
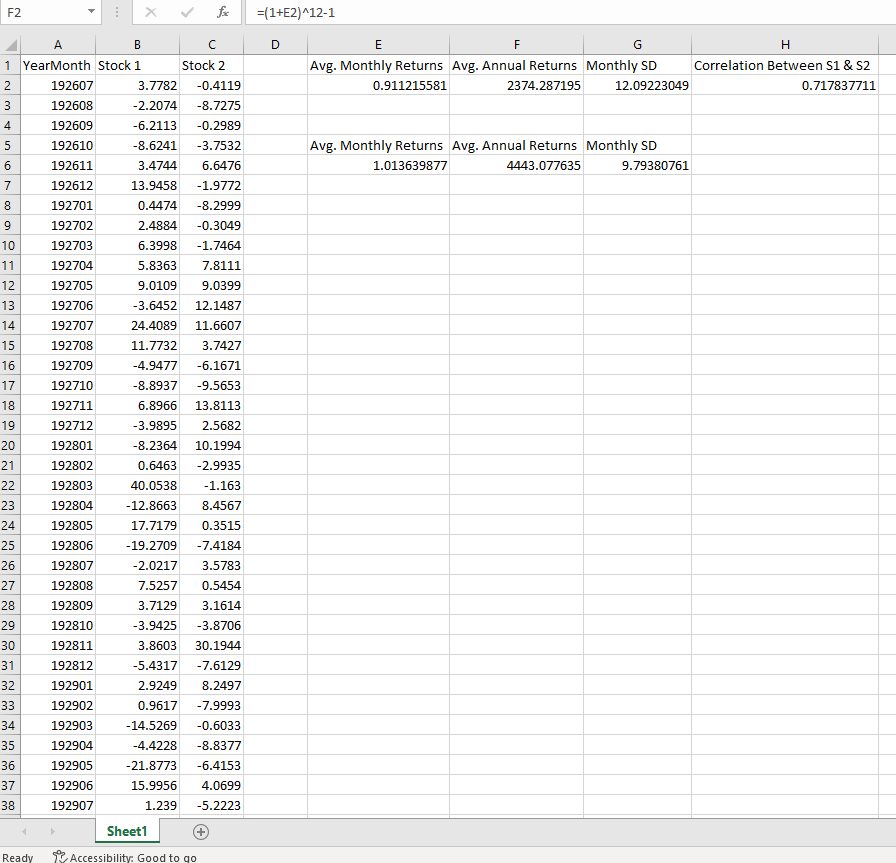
In the excel sheet you will see 3 columns YearMonth, Stock 1 and Stock 2. The number are returns (3.7782 for instance means 3.7782%). Report
In the excel sheet you will see 3 columns YearMonth, Stock 1 and Stock 2. The number are returns (3.7782 for instance means 3.7782%). Report the following:
- What is the average return on Stock 1 and Stock 2?
- What is the standard deviation of Stock 1 and Stock 2?
- What is the correlation between the two Stocks?

Next, you are going to consider a portfolio consisting of a fraction w1 in stock 1 and w2 = 1-w1 in stock 2.
Use the results above to calculate the average return and standard deviation of the portfolio when varying w1 between 0 and 4. What is the minimum variance portfolio?
F2 fx = (1+E2)^12-1 D E F G . Avg. Monthly Returns Avg. Annual Returns Monthly SD Correlation Between S1 & S2 0.911215581 2374.287195 12.09223049 0.717837711 Nm in Avg. Monthly Returns Avg. Annual Returns Monthly SD 1.013639877 4443.077635 9.79380761 B 1 Year Month Stock 1 Stock 2 2 192607 3.7782 -0.4119 3 192608 -2.2074 -8.7275 4 192609 -6.2113 -0.2989 5 192610 -8.6241 -3.7532 6 192611 3.4744 6.6476 192612 13.9458 -1.9772 8 192701 0.4474 -8.2999 9 192702 2.4884 -0.3049 10 192703 6.3998 -1.7464 11 192704 5.8363 7.8111 12 192705 9.0109 9.0399 13 192706 -3.6452 12.1487 14 192707 24.4089 11.6607 15 192708 11.7732 3.7427 16 192709 -4.9477 -6.1671 17 192710 -8.8937 -9.5653 18 192711 6.8966 13.8113 19 192712 -3.9895 2.5682 20 192801 -8.2364 10.1994 21 192802 0.6463 -2.9935 22 192803 40.0538 -1.163 23 192804 -12.8663 8.4567 24 192805 17.7179 0.3515 25 192806 -19.2709 -7.4184 26 192807 -2.0217 3.5783 27 192808 7.5257 0.5454 28 192809 3.7129 3.1614 29 192810 -3.9425 -3.8706 30 192811 3.8603 30.1944 31 192812 -5.4317 -7.6129 32 192901 2.9249 8.2497 33 192902 0.9617 -7.9993 34 192903 -14.5269 -0.6033 35 192904 -4.4228 -8.8377 36 192905 -21.8773 -6.4153 37 192906 15.9956 4.0699 38 192907 1.239 -5.2223 Sheet1 Accessibility: Good to go Ready F2 fx = (1+E2)^12-1 D E F G . Avg. Monthly Returns Avg. Annual Returns Monthly SD Correlation Between S1 & S2 0.911215581 2374.287195 12.09223049 0.717837711 Nm in Avg. Monthly Returns Avg. Annual Returns Monthly SD 1.013639877 4443.077635 9.79380761 B 1 Year Month Stock 1 Stock 2 2 192607 3.7782 -0.4119 3 192608 -2.2074 -8.7275 4 192609 -6.2113 -0.2989 5 192610 -8.6241 -3.7532 6 192611 3.4744 6.6476 192612 13.9458 -1.9772 8 192701 0.4474 -8.2999 9 192702 2.4884 -0.3049 10 192703 6.3998 -1.7464 11 192704 5.8363 7.8111 12 192705 9.0109 9.0399 13 192706 -3.6452 12.1487 14 192707 24.4089 11.6607 15 192708 11.7732 3.7427 16 192709 -4.9477 -6.1671 17 192710 -8.8937 -9.5653 18 192711 6.8966 13.8113 19 192712 -3.9895 2.5682 20 192801 -8.2364 10.1994 21 192802 0.6463 -2.9935 22 192803 40.0538 -1.163 23 192804 -12.8663 8.4567 24 192805 17.7179 0.3515 25 192806 -19.2709 -7.4184 26 192807 -2.0217 3.5783 27 192808 7.5257 0.5454 28 192809 3.7129 3.1614 29 192810 -3.9425 -3.8706 30 192811 3.8603 30.1944 31 192812 -5.4317 -7.6129 32 192901 2.9249 8.2497 33 192902 0.9617 -7.9993 34 192903 -14.5269 -0.6033 35 192904 -4.4228 -8.8377 36 192905 -21.8773 -6.4153 37 192906 15.9956 4.0699 38 192907 1.239 -5.2223 Sheet1 Accessibility: Good to go ReadyStep by Step Solution
There are 3 Steps involved in it
Step: 1

Get Instant Access to Expert-Tailored Solutions
See step-by-step solutions with expert insights and AI powered tools for academic success
Step: 2

Step: 3

Ace Your Homework with AI
Get the answers you need in no time with our AI-driven, step-by-step assistance
Get Started


