

Question
In the figure below, the experiment carried out by Darken, (L.S. Darken, 1949, Trans. AIME, 180:430-438) shows the concentration of Carbon throughout a diffusion couple
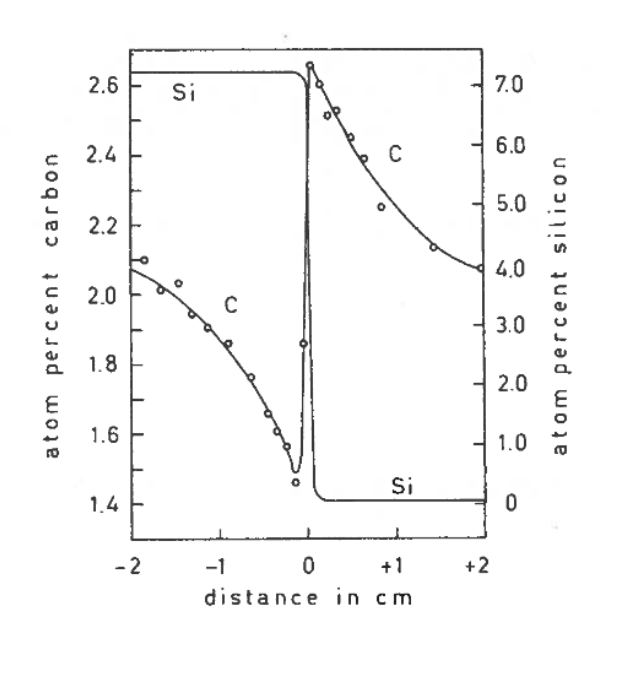 In the figure below, the experiment carried out by Darken, (L.S. Darken, 1949, Trans. AIME, 180:430-438) shows the concentration of Carbon throughout a diffusion couple of Fe-C-Si and Fe-C, held for 13 days at 1323K. The initial diffusion couple had a constant C composition throughout the entire sample and the Si was present in the left part of the initial diffusion couple and there was no Si in the right hand side. 1. What is the effect of the Si on the chemical potential of the Carbon in the Iron? Explain how you know this. (Assume that the Si does not diffuse over this time period.) 2. Does the observation contradict Ficks first law? Explain.
Step by Step Solution
There are 3 Steps involved in it
Step: 1

Get Instant Access to Expert-Tailored Solutions
See step-by-step solutions with expert insights and AI powered tools for academic success
Step: 2

Step: 3
Ace Your Homework with AI
Get the answers you need in no time with our AI-driven, step-by-step assistance
Get Started
Introduction To Chemical Engineering Computing
Authors: Bruce A. Finlayson
2nd Edition
1118888316, 978-1118888315