Question
In the first stage of using the X chart and MR chart you created the control limits. Now pretend to be the worker and

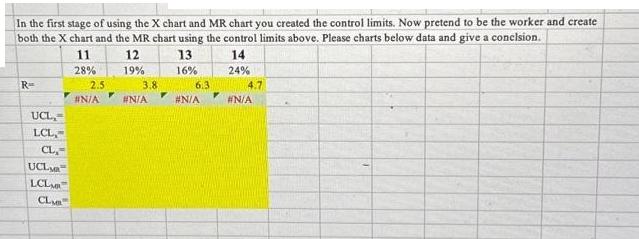
In the first stage of using the X chart and MR chart you created the control limits. Now pretend to be the worker and create both the X chart and the MR chart using the control limits above. Please charts below data and give a concision. 11 12 13 14 28% 19% 16% 24% R== UCL= LCL, CL= UCL LCL CL 2.5 #N/A Y 3.8 #N/A 6.3 #N/A Y 4.7 #N/A
Step by Step Solution
3.37 Rating (147 Votes )
There are 3 Steps involved in it
Step: 1

Get Instant Access to Expert-Tailored Solutions
See step-by-step solutions with expert insights and AI powered tools for academic success
Step: 2

Step: 3

Ace Your Homework with AI
Get the answers you need in no time with our AI-driven, step-by-step assistance
Get StartedRecommended Textbook for
Smith and Roberson Business Law
Authors: Richard A. Mann, Barry S. Roberts
15th Edition
1285141903, 1285141903, 9781285141909, 978-0538473637
Students also viewed these General Management questions
Question
Answered: 1 week ago
Question
Answered: 1 week ago
Question
Answered: 1 week ago
Question
Answered: 1 week ago
Question
Answered: 1 week ago
Question
Answered: 1 week ago
Question
Answered: 1 week ago
Question
Answered: 1 week ago
Question
Answered: 1 week ago
Question
Answered: 1 week ago
Question
Answered: 1 week ago
Question
Answered: 1 week ago
Question
Answered: 1 week ago
Question
Answered: 1 week ago
Question
Answered: 1 week ago
Question
Answered: 1 week ago
Question
Answered: 1 week ago
Question
Answered: 1 week ago
Question
Answered: 1 week ago
Question
Answered: 1 week ago
Question
Answered: 1 week ago
Question
Answered: 1 week ago
View Answer in SolutionInn App


