Answered step by step
Verified Expert Solution
Question
1 Approved Answer
In the following graph we observe the probability distributions of assets A and B. s Distribution of asset A Distribution of asset B Select TRUE
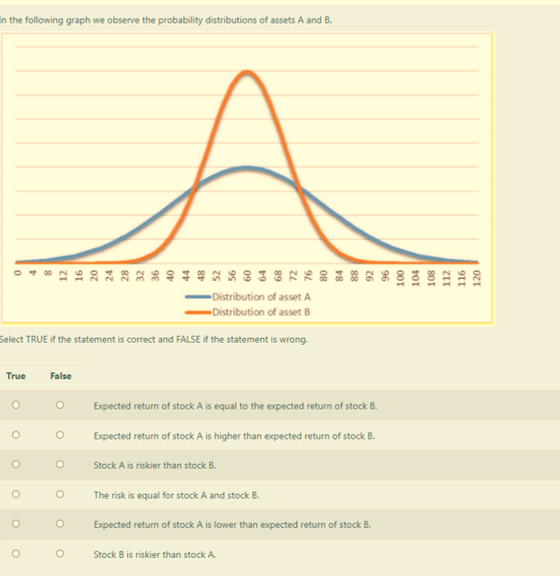
In the following graph we observe the probability distributions of assets A and B. s Distribution of asset A Distribution of asset B Select TRUE if the statement is correct and FALSE if the statement is wrong. True False O O O O 88 76 96 Expected return of stock A is equal to the expected return of stock B. Expected return of stock A is higher than expected return of stock B. Stock A is riskier than stock B. The risk is equal for stock A and stock B. Expected return of stock A is lower than expected return of stock B. Stock B is riskier than stock A. 100 104 108 112 116 120
Step by Step Solution
There are 3 Steps involved in it
Step: 1
Get Instant Access to Expert-Tailored Solutions
See step-by-step solutions with expert insights and AI powered tools for academic success
Step: 2
Step: 3
Ace Your Homework with AI
Get the answers you need in no time with our AI-driven, step-by-step assistance
Get Started