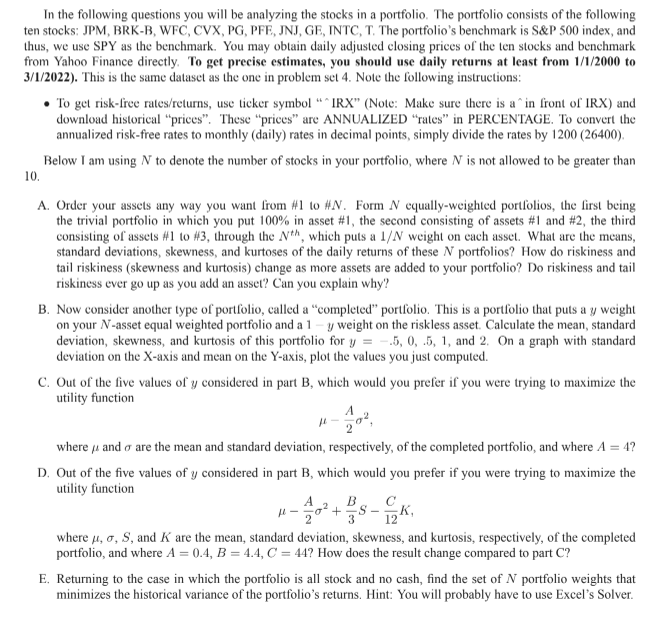
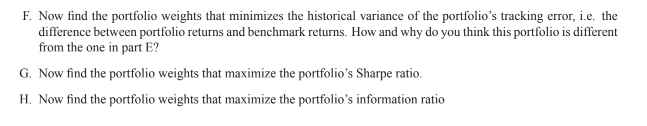
In the following questions you will be analyzing the stocks in a portfolio. The portfolio consists of the following ten stocks: JPM, BRK-B, WFC, CVX, PG, PFE, JNJ, GE, INTC, T. The portfolio's benchmark is S&P 500 index, and thus, we use SPY as the benchmark. You may obtain daily adjusted closing prices of the ten stocks and benchmark from Yahoo Finance directly. To get precise estimates, you should use daily returns at least from 1/1/2000 to 3/1/2022). This is the same dataset as the one in problem set 4. Note the following instructions: To get risk-free rates/returns, use ticker symbol "IRX" (Note: Make sure there is a^ in front of IRX) and download historical "prices". These "prices" are ANNUALIZED "rates" in PERCENTAGE. To convert the annualized risk-free rates to monthly (daily) rates in decimal points, simply divide the rates by 1200 (26400). Below I am using N to denote the number of stocks in your portfolio, where N is not allowed to be greater than 10. A. Order your assets any way you want from #1 to #N. Form N equally-weighted portfolios, the first being the trivial portfolio in which you put 100% in asset # 1, the second consisting of assets #1 and # 2 , the third consisting of assets #1 to #3, through the Nth, which puts a 1/N weight on each asset. What are the means, standard deviations, skewness, and kurtoses of the daily returns of these N portfolios? How do riskiness and tail riskiness (skewness and kurtosis) change as more assets are added to your portfolio? Do riskiness and tail riskiness ever go up as you add an asset? Can you explain why? B. Now consider another type of portfolio, called a "completed" portfolio. This is a portfolio that puts a y weight on your N-asset equal weighted portfolio and a 1-y weight on the riskless asset. Calculate the mean, standard deviation, skewness, and kurtosis of this portfolio for y=-.5, 0, 5, 1, and 2. On a graph with standard deviation on the X-axis and mean on the Y-axis, plot the values you just computed. C. Out of the five values of y considered in part B, which would you prefer if you were trying to maximize the utility function 2 where and are the mean and standard deviation, respectively, of the completed portfolio, and where A = 4? D. Out of the five values of y considered in part B, which would you prefer if you were trying to maximize the utility function A -20 + S- K B 3 where , , S, and K are the mean, standard deviation, skewness, and kurtosis, respectively, of the completed portfolio, and where A = 0.4, B = 4.4, C = 44? How does the result change compared to part C? E. Returning to the case in which the portfolio is all stock and no cash, find the set of N portfolio weights that minimizes the historical variance of the portfolio's returns. Hint: You will probably have to use Excel's Solver. F. Now find the portfolio weights that minimizes the historical variance of the portfolio's tracking error, i.e. the difference between portfolio returns and benchmark returns. How and why do you think this portfolio is different from the one in part E? G. Now find the portfolio weights that maximize the portfolio's Sharpe ratio. H. Now find the portfolio weights that maximize the portfolio's information ratio In the following questions you will be analyzing the stocks in a portfolio. The portfolio consists of the following ten stocks: JPM, BRK-B, WFC, CVX, PG, PFE, JNJ, GE, INTC, T. The portfolio's benchmark is S&P 500 index, and thus, we use SPY as the benchmark. You may obtain daily adjusted closing prices of the ten stocks and benchmark from Yahoo Finance directly. To get precise estimates, you should use daily returns at least from 1/1/2000 to 3/1/2022). This is the same dataset as the one in problem set 4. Note the following instructions: To get risk-free rates/returns, use ticker symbol "IRX" (Note: Make sure there is a^ in front of IRX) and download historical "prices". These "prices" are ANNUALIZED "rates" in PERCENTAGE. To convert the annualized risk-free rates to monthly (daily) rates in decimal points, simply divide the rates by 1200 (26400). Below I am using N to denote the number of stocks in your portfolio, where N is not allowed to be greater than 10. A. Order your assets any way you want from #1 to #N. Form N equally-weighted portfolios, the first being the trivial portfolio in which you put 100% in asset # 1, the second consisting of assets #1 and # 2 , the third consisting of assets #1 to #3, through the Nth, which puts a 1/N weight on each asset. What are the means, standard deviations, skewness, and kurtoses of the daily returns of these N portfolios? How do riskiness and tail riskiness (skewness and kurtosis) change as more assets are added to your portfolio? Do riskiness and tail riskiness ever go up as you add an asset? Can you explain why? B. Now consider another type of portfolio, called a "completed" portfolio. This is a portfolio that puts a y weight on your N-asset equal weighted portfolio and a 1-y weight on the riskless asset. Calculate the mean, standard deviation, skewness, and kurtosis of this portfolio for y=-.5, 0, 5, 1, and 2. On a graph with standard deviation on the X-axis and mean on the Y-axis, plot the values you just computed. C. Out of the five values of y considered in part B, which would you prefer if you were trying to maximize the utility function 2 where and are the mean and standard deviation, respectively, of the completed portfolio, and where A = 4? D. Out of the five values of y considered in part B, which would you prefer if you were trying to maximize the utility function A -20 + S- K B 3 where , , S, and K are the mean, standard deviation, skewness, and kurtosis, respectively, of the completed portfolio, and where A = 0.4, B = 4.4, C = 44? How does the result change compared to part C? E. Returning to the case in which the portfolio is all stock and no cash, find the set of N portfolio weights that minimizes the historical variance of the portfolio's returns. Hint: You will probably have to use Excel's Solver. F. Now find the portfolio weights that minimizes the historical variance of the portfolio's tracking error, i.e. the difference between portfolio returns and benchmark returns. How and why do you think this portfolio is different from the one in part E? G. Now find the portfolio weights that maximize the portfolio's Sharpe ratio. H. Now find the portfolio weights that maximize the portfolio's information ratio