

Answered step by step
Verified Expert Solution
Question
1 Approved Answer
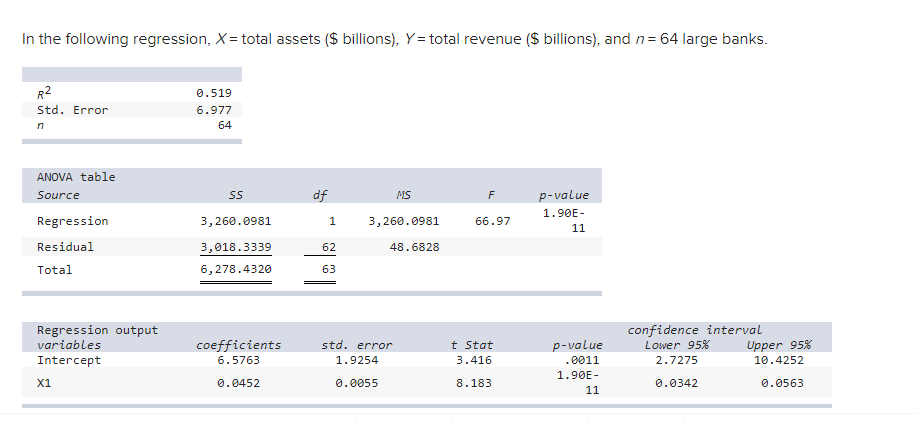
In the following regression, X = total assets ($ billions), Y = total revenue ($ billions), and / = 64 large banks. R2 0.519 Std.
Step by Step Solution
There are 3 Steps involved in it
Step: 1

Get Instant Access to Expert-Tailored Solutions
See step-by-step solutions with expert insights and AI powered tools for academic success
Step: 2

Step: 3
Ace Your Homework with AI
Get the answers you need in no time with our AI-driven, step-by-step assistance
Get Started
Finite Math And Applied Calculus
Authors: Stefan Waner, Steven Costenoble
2nd Edition
0534366309, 9780534366308