Answered step by step
Verified Expert Solution
Question
1 Approved Answer
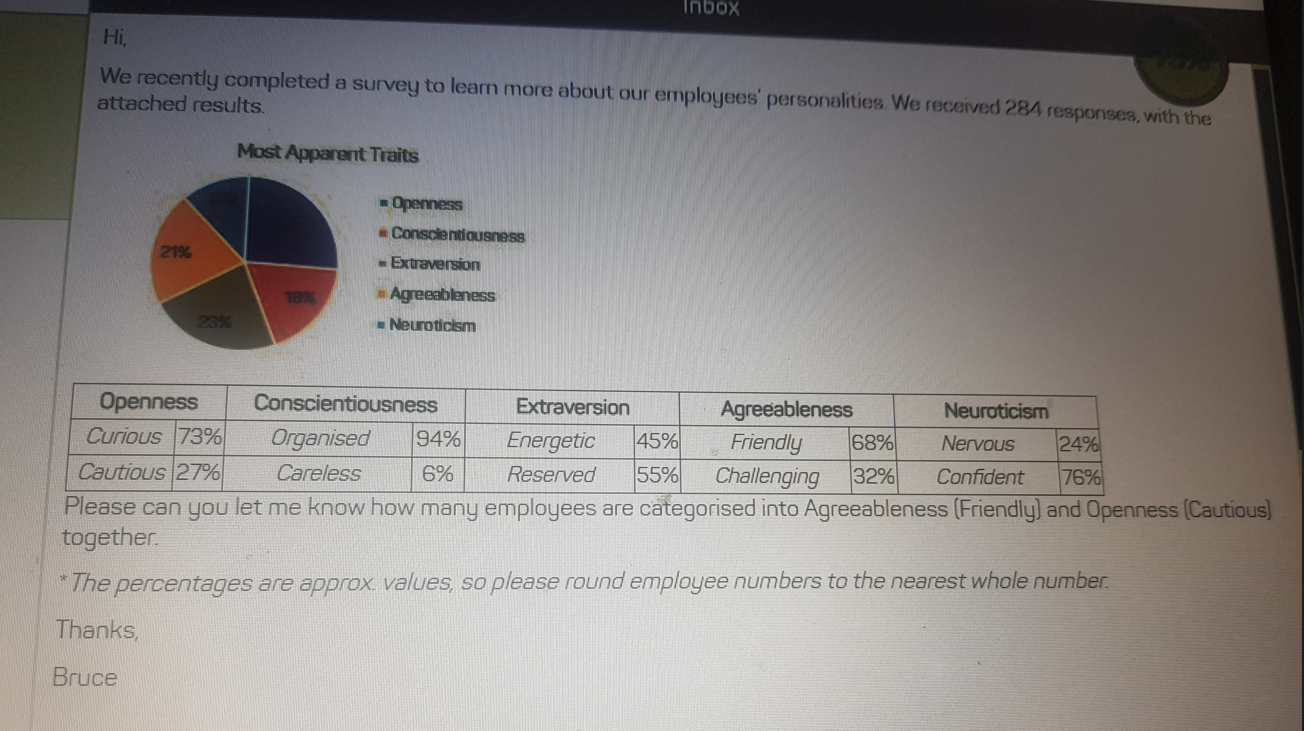
In the images above, it tells you the openness category accounts for 26% out of 284 responses. and Agreeableness accounts for 18% out of 284

In the images above, it tells you the openness category accounts for 26% out of 284 responses. and Agreeableness accounts for 18% out of 284 responses. ( That is the way I interpret the pie chart). From there, the openness categories divides into cautious 27%, and curious 73%. The agreeableness divides into friendly 68%, and challenging 32%.
- Together these two categories equal 134.
- In sum, these two trait categories equal 73.
- The total of these two categories together is 61.
- 178 is the sum of these two categories.
The previous answer you provided 274 is wrong. I used Agreeableness: 284*18%*68%=34, Openness: 284*26%*27%=20. 34+20= 54. I cannot find the answer option either. Any idea where it goes wrong.
We recently completed a survey to learn more about our employees' personalities. We received 284 responses, with the attached results. Most Apparent Traits - Openness - Consctentiousness - Extraversion Agreaghleness - Neuroticlsm Please can you let me know how many employees are categorised into Agreeableness (Friendly) and Openness (Cautious) together. The percentages are approx. values, so please round employee numbers to the nearest whole number. Thanks, BruceStep by Step Solution
There are 3 Steps involved in it
Step: 1

Get Instant Access to Expert-Tailored Solutions
See step-by-step solutions with expert insights and AI powered tools for academic success
Step: 2

Step: 3

Ace Your Homework with AI
Get the answers you need in no time with our AI-driven, step-by-step assistance
Get Started


