

Answered step by step
Verified Expert Solution
Question
1 Approved Answer
In the Minimum Variance Portfolio of two risky assets, show your algebra to find the weight of one of the two assets Investment opportunity set
In the Minimum Variance Portfolio of two risky assets, show your algebra to find the weight of one of the two assets
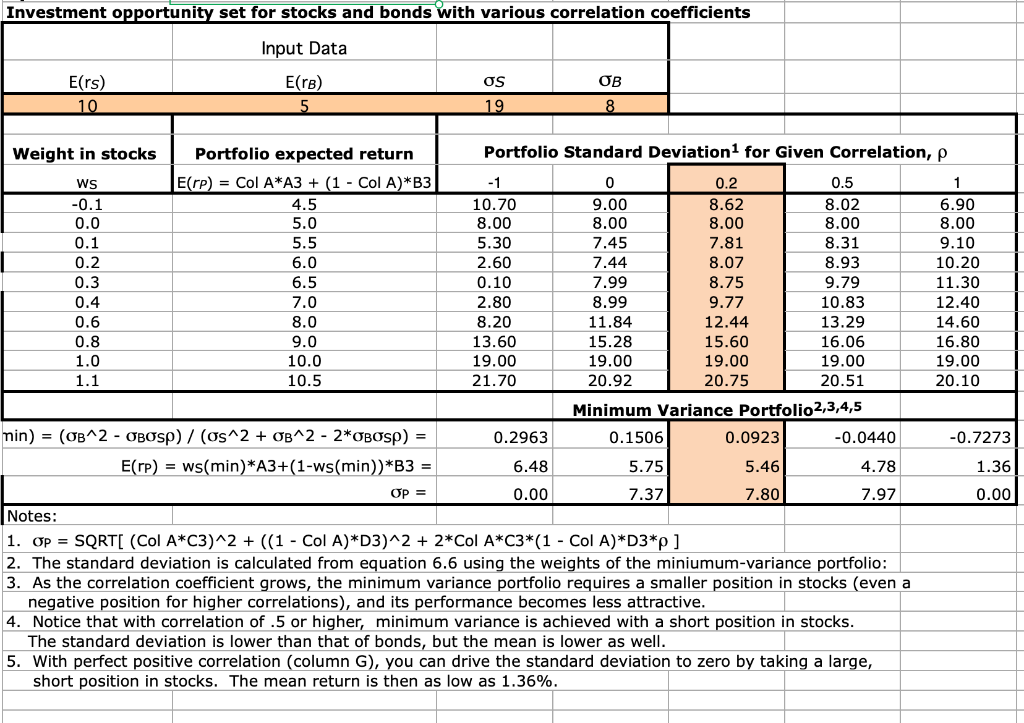
Investment opportunity set for stocks and bonds with various correlation coefficients Input Data E(TB) 5 Ers) 10 OB OS 19 8 Weight in stocks Portfolio expected return Portfolio Standard Deviation for Given Correlation, p ws E(TP) = Col A*A3 + (1 - Col A)*B3 -1 0 0.2 0.5 1 -0.1 4.5 10.70 9.00 8.62 8.02 6.90 0.0 5.0 8.00 8.00 8.00 8.00 8.00 0.1 5.5 5.30 7.45 7.81 8.31 9.10 0.2 6.0 2.60 7.44 8.07 8.93 10.20 0.3 6.5 0.10 7.99 8.75 9.79 11.30 0.4 7.0 2.80 8.99 9.77 10.83 12.40 0.6 8.0 8.20 11.84 12.44 13.29 14.60 0.8 9.0 13.60 15.28 15.60 16.06 16.80 1.0 10.0 19.00 19.00 19.00 19.00 19.00 1.1 10.5 21.70 20.92 20.75 20.51 20.10 Minimum Variance Portfolio 2,3,4,5 min) = (OB^2 - OBOSP) / (os^2 + B^2 - 2*OBOsp) = 0.2963 0.1506 0.0923 -0.0440 -0.7273 E(rp) = ws(min)*A3+(1-ws(min))*B3 = 6.48 5.75 5.46 4.78 1.36 Op = 0.00 7.37 7.80 7.97 0.00 Notes: 1. Op = SQRT[ (Col A*C3)^2 + ((1 - Col A)*D3)^2 + 2*Col A*C3*(1 - Col A)*D3*p ] 2. The standard deviation is calculated from equation 6.6 using the weights of the miniumum-variance portfolio: 3. As the correlation coefficient grows, the minimum variance portfolio requires a smaller position in stocks (even a negative position for higher correlations), and its performance becomes less attractive. 4. Notice that with correlation of .5 or higher, minimum variance is achieved with a short position in stocks. The standard deviation is lower than that of bonds, but the mean is lower as well. 5. With perfect positive correlation (column G), you can drive the standard deviation to zero by taking a large, short position in stocks. The mean return is then as low as 1.36%. Investment opportunity set for stocks and bonds with various correlation coefficients Input Data E(TB) 5 Ers) 10 OB OS 19 8 Weight in stocks Portfolio expected return Portfolio Standard Deviation for Given Correlation, p ws E(TP) = Col A*A3 + (1 - Col A)*B3 -1 0 0.2 0.5 1 -0.1 4.5 10.70 9.00 8.62 8.02 6.90 0.0 5.0 8.00 8.00 8.00 8.00 8.00 0.1 5.5 5.30 7.45 7.81 8.31 9.10 0.2 6.0 2.60 7.44 8.07 8.93 10.20 0.3 6.5 0.10 7.99 8.75 9.79 11.30 0.4 7.0 2.80 8.99 9.77 10.83 12.40 0.6 8.0 8.20 11.84 12.44 13.29 14.60 0.8 9.0 13.60 15.28 15.60 16.06 16.80 1.0 10.0 19.00 19.00 19.00 19.00 19.00 1.1 10.5 21.70 20.92 20.75 20.51 20.10 Minimum Variance Portfolio 2,3,4,5 min) = (OB^2 - OBOSP) / (os^2 + B^2 - 2*OBOsp) = 0.2963 0.1506 0.0923 -0.0440 -0.7273 E(rp) = ws(min)*A3+(1-ws(min))*B3 = 6.48 5.75 5.46 4.78 1.36 Op = 0.00 7.37 7.80 7.97 0.00 Notes: 1. Op = SQRT[ (Col A*C3)^2 + ((1 - Col A)*D3)^2 + 2*Col A*C3*(1 - Col A)*D3*p ] 2. The standard deviation is calculated from equation 6.6 using the weights of the miniumum-variance portfolio: 3. As the correlation coefficient grows, the minimum variance portfolio requires a smaller position in stocks (even a negative position for higher correlations), and its performance becomes less attractive. 4. Notice that with correlation of .5 or higher, minimum variance is achieved with a short position in stocks. The standard deviation is lower than that of bonds, but the mean is lower as well. 5. With perfect positive correlation (column G), you can drive the standard deviation to zero by taking a large, short position in stocks. The mean return is then as low as 1.36%
Step by Step Solution
There are 3 Steps involved in it
Step: 1

Get Instant Access to Expert-Tailored Solutions
See step-by-step solutions with expert insights and AI powered tools for academic success
Step: 2

Step: 3
Ace Your Homework with AI
Get the answers you need in no time with our AI-driven, step-by-step assistance
Get Started
Financial management theory and practice
Authors: Eugene F. Brigham and Michael C. Ehrhardt
13th edition
1439078106, 111197375X, 9781439078105, 9781111973759, 978-1439078099