Answered step by step
Verified Expert Solution
Question
1 Approved Answer
In the original data set are 399 rows. Please show a solution just for the 6 rows of data shown above. Thanks. Ralphie is fascinated


In the original data set are 399 rows. Please show a solution just for the 6 rows of data shown above. Thanks.
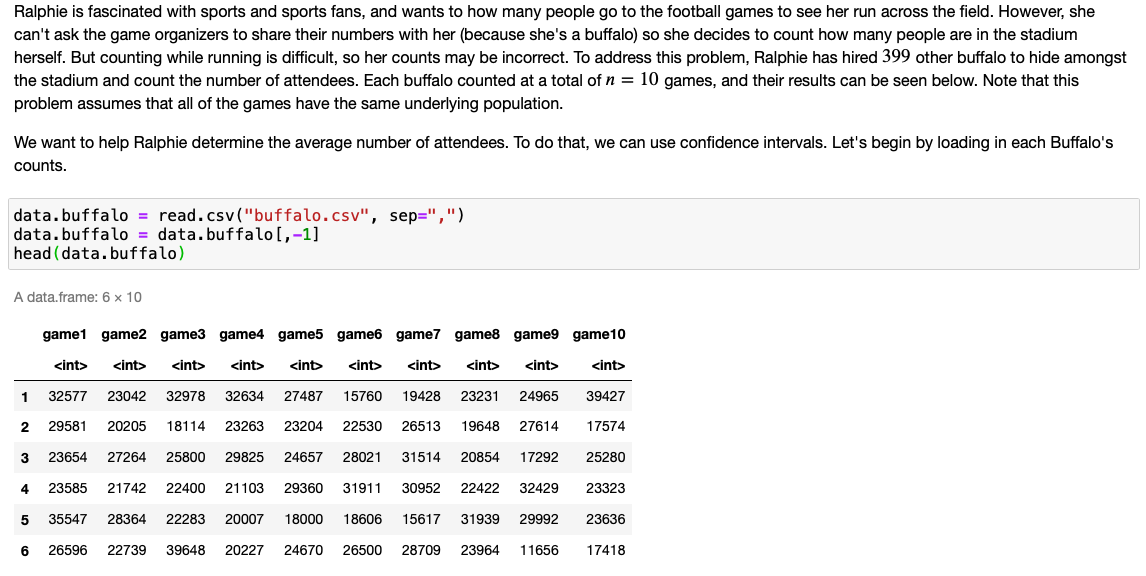
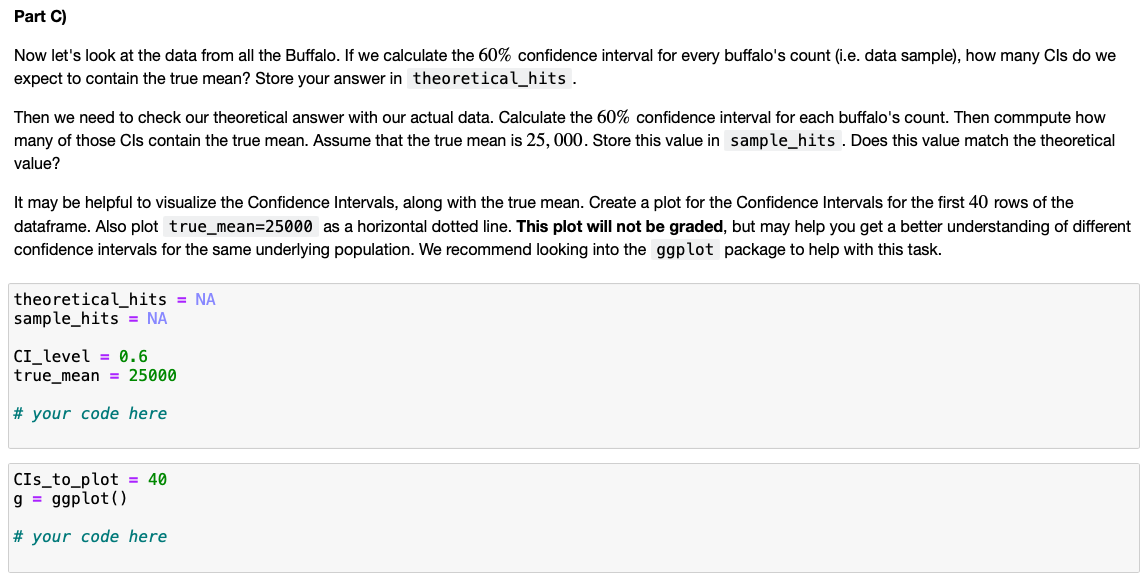
Ralphie is fascinated with sports and sports fans, and wants to how many people go to the football games to see her run across the field. However, she can't ask the game organizers to share their numbers with her (because she's a buffalo) so she decides to count how many people are in the stadium herself. But counting while running is difficult, so her counts may be incorrect. To address this problem, Ralphie has hired 399 other buffalo to hide amongst the stadium and count the number of attendees. Each buffalo counted at a total of n = 10 games, and their results can be seen below. Note that this problem assumes that all of the games have the same underlying population. We want to help Ralphie determine the average number of attendees. To do that, we can use confidence intervals. Let's begin by loading in each Buffalo's counts. data.buffalo = read.csv ("buffalo.csv", sep=",") data. buffalo = data. buffalol,-1] head (data. buffalo) A data.frame: 6 x 10 game1 game2 game3 game4 game5 game6 game7 game8 game game10 sint> sint> sint sint sint sint> sint> sint> sint> sint> 1 32577 23042 32978 32634 27487 15760 19428 23231 24965 39427 2 29581 20205 18114 23263 23204 22530 26513 19648 27614 17574 3 23654 27264 25800 29825 24657 28021 31514 20854 17292 25280 4 23585 21742 22400 21103 29360 31911 30952 22422 32429 23323 5 35547 28364 22283 20007 18000 18606 15617 31939 29992 23636 6 26596 22739 39648 20227 24670 26500 28709 23964 11656 17418 Part C) Now let's look at the data from all the Buffalo. If we calculate the 60% confidence interval for every buffalo's count (i.e. data sample), how many Cls do we expect to contain the true mean? Store your answer in theoretical_hits. Then we need to check our theoretical answer with our actual data. Calculate the 60% confidence interval for each buffalo's count. Then commpute how many of those Cls contain the true mean. Assume that the true mean is 25,000. Store this value in sample_hits . Does this value match the theoretical value? It may be helpful to visualize the Confidence Intervals, along with the true mean. Create a plot for the Confidence Intervals for the first 40 rows of the dataframe. Also plot true_mean=25000 as a horizontal dotted line. This plot will not be graded, but may help you get a better understanding of different confidence intervals for the same underlying population. We recommend looking into the ggplot package to help with this task. theoretical_hits = NA sample_hits = NA CI_level = 0.6 true_mean = 25000 # your code here CIs_to_plot = 40 g = ggplot() # your code hereStep by Step Solution
There are 3 Steps involved in it
Step: 1

Get Instant Access to Expert-Tailored Solutions
See step-by-step solutions with expert insights and AI powered tools for academic success
Step: 2

Step: 3

Ace Your Homework with AI
Get the answers you need in no time with our AI-driven, step-by-step assistance
Get Started


