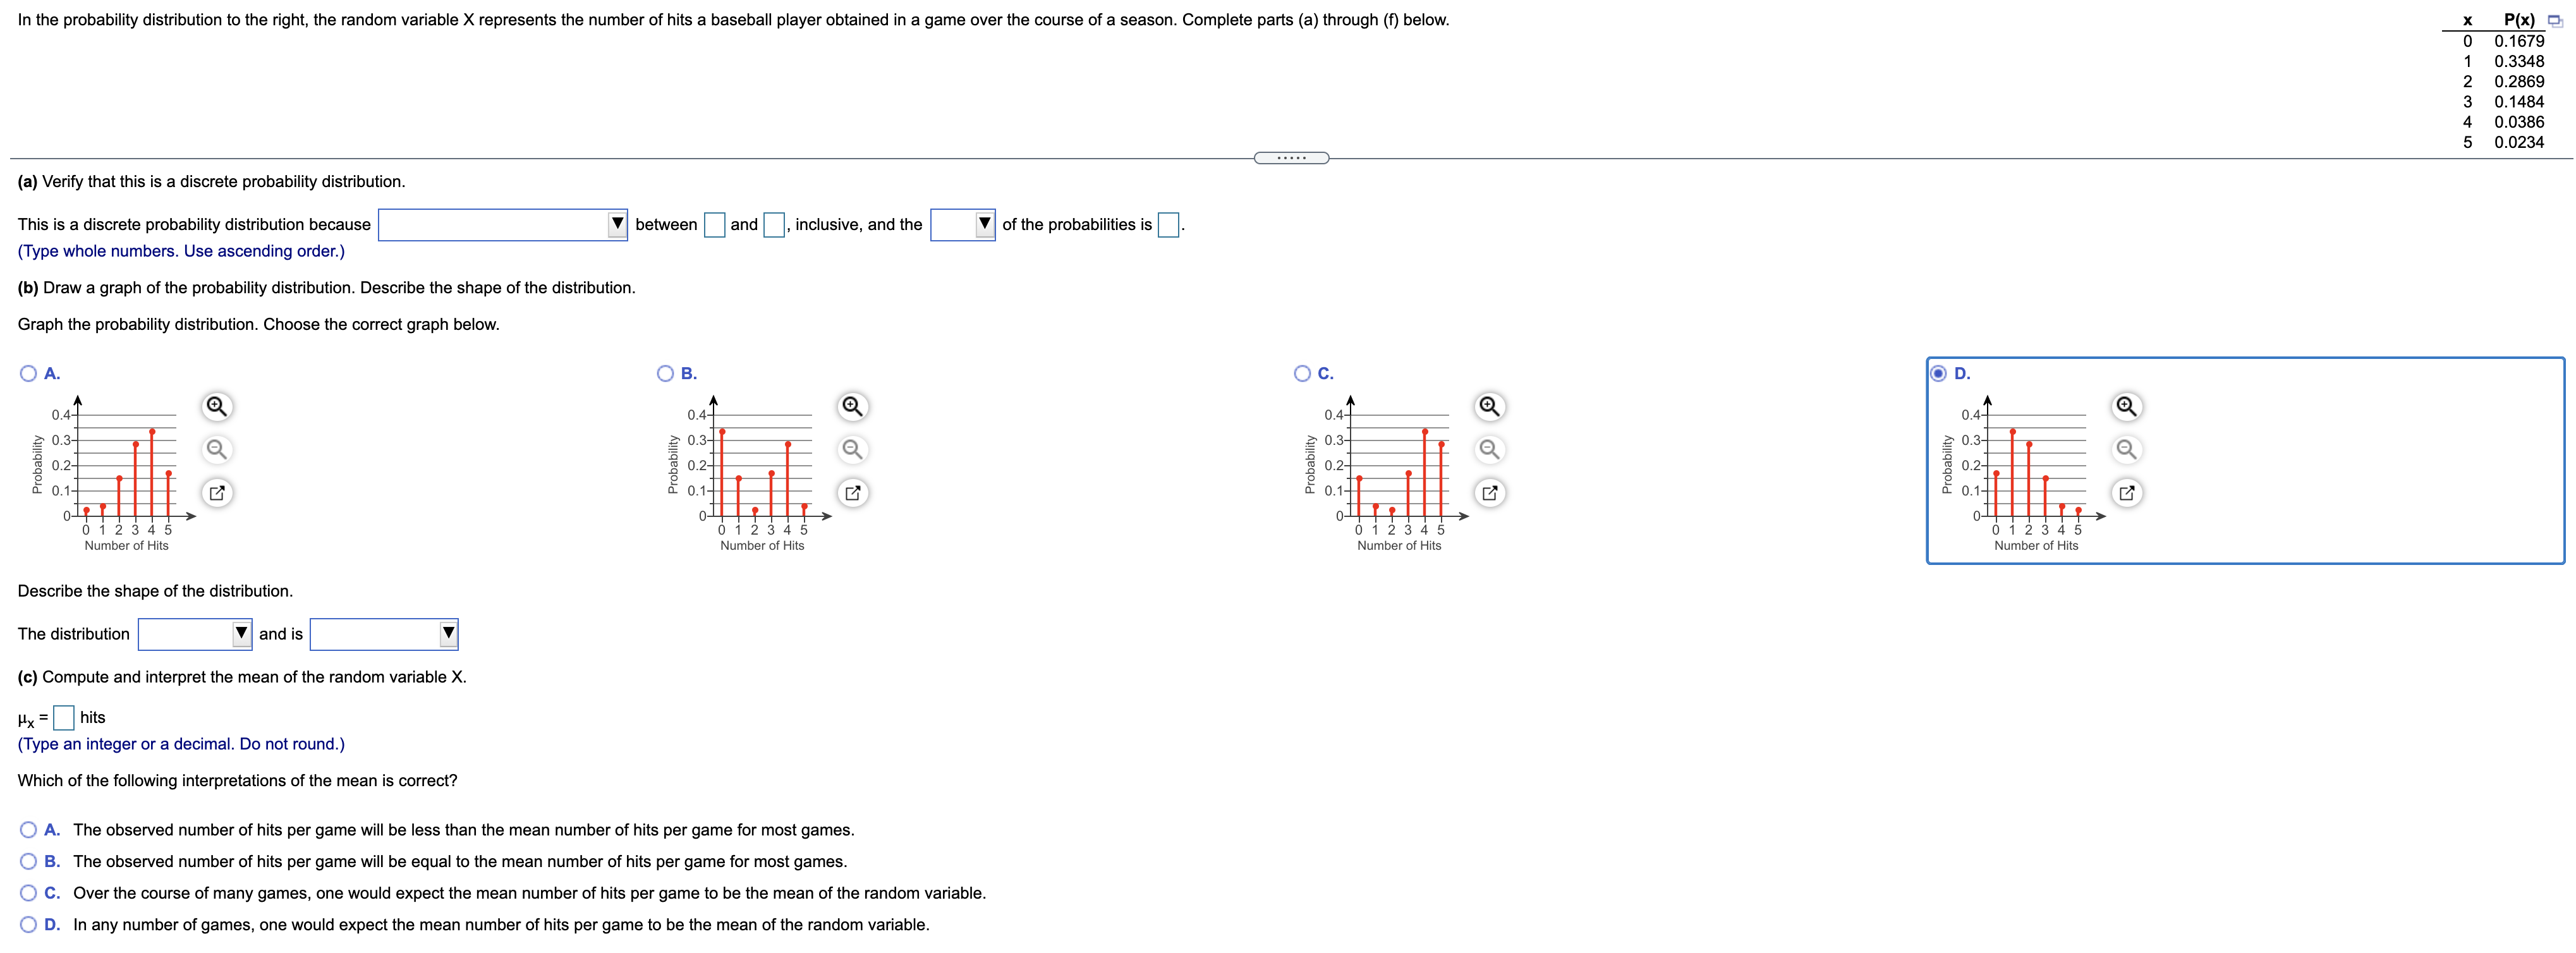
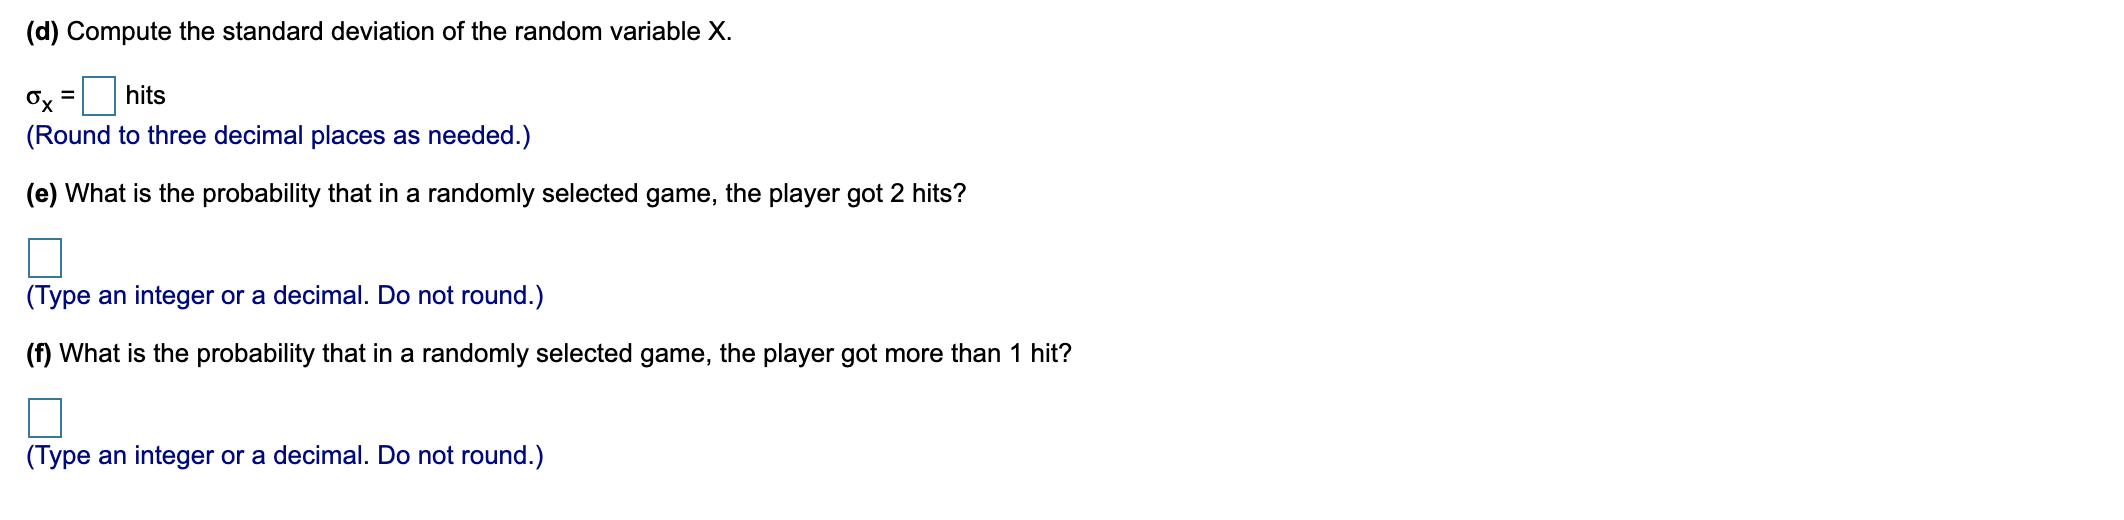
In the probability distribution to the right, the random variable X represents the number of hits a baseball player obtained in a game over the course of a season. Complete parts (a) through (f) below. X P(x) 0.1679 0.3348 0.2869 .1484 0.0386 0.0234 (a) Verify that this is a discrete probability distribution. This is a discrete probability distribution because between and , inclusive, and the of the probabilities is. (Type whole numbers. Use ascending order.) (b) Draw a graph of the probability distribution. Describe the shape of the distribution. Graph the probability distribution. Choose the correct graph below. O A. OB. O c. OD. 0.4- 0.4- 0.4- 0.4- 0.3- 0.3- 0.3- 0.2- Probability Probability 0.2- 0.2- Probability 0.2- 0.1- :0.1- 0.1- : 0.1- 012345 0 1 2 3 4 5 012345 0123 4 5 Number of Hits Number of Hits Number of Hits Number of Hits Describe the shape of the distribution. The distribution and is (c) Compute and interpret the mean of the random variable X. Hx = hits (Type an integer or a decimal. Do not round.) Which of the following interpretations of the mean is correct? O A. The observed number of hits per game will be less than the mean number of hits per game for most games. O B. The observed number of hits per game will be equal to the mean number of hits per game for most games. O C. Over the course of many games, one would expect the mean number of hits per game to be the mean of the random variable. O D. In any number of games, one would expect the mean number of hits per game to be the mean of the random variable.(d) Compute the standard deviation of the random variable X. 6x = D hits (Round to three decimal places as needed.) (a) What is the probability that in a randomly selected game, the player got 2 hits? I: (Type an integer or a decimal. Do not round.) (f) What is the probability that in a randomly selected game, the player got more than 1 hit? E (Type an integer or a decimal. Do not round.)