Answered step by step
Verified Expert Solution
Question
1 Approved Answer
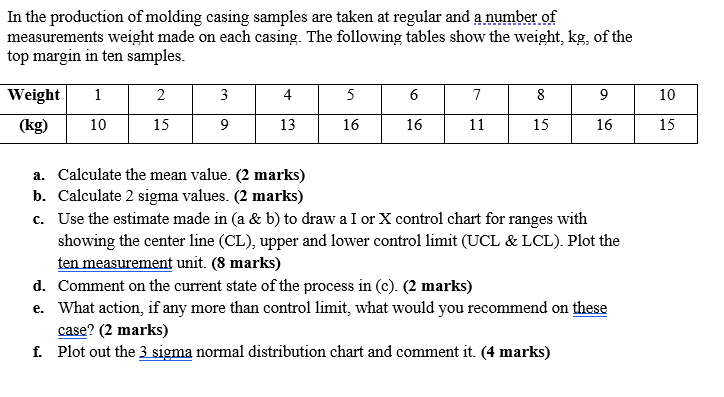
In the production of molding casing samples are taken at regular and a number of measurements weight made on each casing. The following tables show
In the production of molding casing samples are taken at regular and a number of
measurements weight made on each casing. The following tables show the weight, of the
top margin in ten samples.
a Calculate the mean value. marks
b Calculate sigma values. marks
c Use the estimate made in a & b to draw a I or X control chart for ranges with
showing the center line CL upper and lower control limit UCL & LCL Plot the
ten measurement unit. marks
d Comment on the current state of the process in c marks
e What action, if any more than control limit what would you recommend on these
case? marks
f Plot out the sigma normal distribution chart and comment it marks

Step by Step Solution
There are 3 Steps involved in it
Step: 1

Get Instant Access to Expert-Tailored Solutions
See step-by-step solutions with expert insights and AI powered tools for academic success
Step: 2

Step: 3

Ace Your Homework with AI
Get the answers you need in no time with our AI-driven, step-by-step assistance
Get Started


