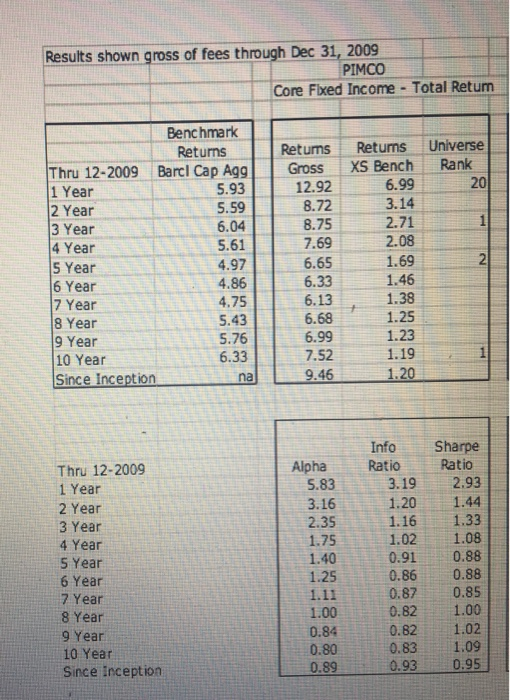
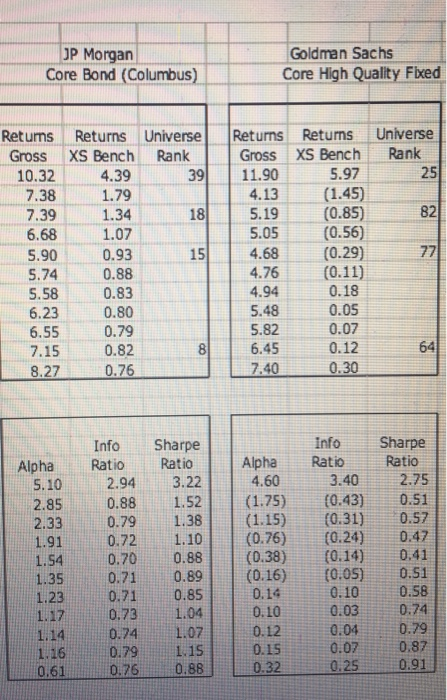
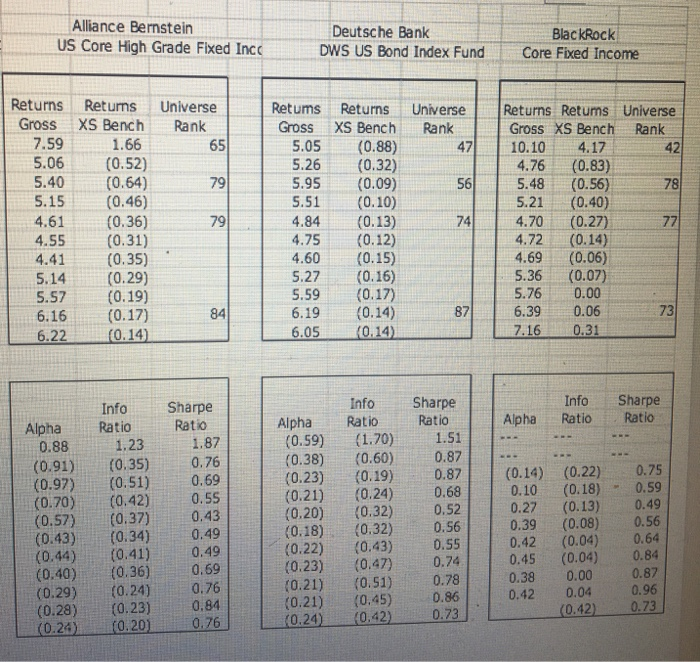
In the schedule below are annualized returns over various periods for selected bond managers through December 2009. For example, Manager A (Pimco) has earned gross returns of 7.52% annually, from 2000 to 2009 (10 years), and in 2009, earned 12.92%. The Barclays Capital Aggregate benchmark earned 6.33% and 5.93% over the same two periods, respectively. Pimcos alpha over the ten year period was 0.80%. Pimcos information ratio during 2009 was 3.19, which represents its monthly return spread over the benchmark return divided by the standard deviation of returns over the 12 month period. Pimcos Sharpe ratio for the four year return period was 1.08, which represents Pimcos excess monthly returns over the risk free rate divided by the standard deviation of its monthly returns over the 48 month time period.
Which manager has the most risk? Why?
Which manager has the least risk? Why?
Which fund has the best performance?
Results shown gross of fees through Dec 31, 2009 PIMCO Core Fixed Income - Total Retum Retums Gross 12.92 8.72 8.75 Universe Rank 20 Returns XS Bench 6.99 3.14 2.71 2.08 1.69 1.46 6.04 Benchmark Returns Thru 12-2009 Barcl Cap Agg 1 Year 5.93 2 Year 5.59 3 Year 4 Year 5.61 5 Year 4.97 6 Year 4.86 7 Year 4.75 8 Year 5.43 9 Year 5.76 10 Year 6.33 Since inception 7.69 1.38 6.65 6.33 6.13 6.68 6.99 7.52 9.46 1.25 1.23 1.19 1.20 na Alpha 5.83 3.16 2.35 1.75 1.40 InfoS harpe Ratio Ratio 3.19 2.93 1.20 1.44 1.16 1.33 1.02 1.08 0.91 0.86 0.88 0.87 0.85 0.82 1.00 0.82 1.02 1.09 0.95 Thru 12-2009 1 Year 2 Year 3 Year 4 Year 5 Year 6 Year 7 Year 8 Year 9 Year 10 Year Since inception 0.88 1.25 1.11 1.00 0.84 0.80 0.89 0.93 JP Morgan Core Bond (Columbus) Goldman Sachs Core High Quality Fixed Universe Rank 25 82 Retums Returns Universe Gross XS Bench Rank 10.32 4.39 3 9 7.38 1.79 7.39 1.34 6.68 1.07 5.90 5.74 0.88 5.58 0.83 6.23 6.55 0.79 7.15 0.82 8.27 0.76 0.93 Returns Returns Gross XS Bench 11.90 5.97 4.13 (1.45) 5.19 (0.85) 5.05 (0.56) 4.68 (0.29) 4.76 (0.11) 4.94 0.18 0.05 5.82 0.07 6.45 0.12 7.40 0.30 0.80 5.48 Info Ratio 2.94 Sharpe Ratio 3.22 Alpha 5.10 2.85 2.33 1.91 1.54 0.88 1.52 Alpha 4.60 (1.75) (1.15) (0.76) 1.38 Info Ratio 3.40 (0.43) (0.31) (0.24) (0.14) (0.05) 1.10 0.88 (0.38) Sharpe Ratio 2.75 0.51 0.57 0.47 0.41 0.51 0.58 0.74 0.79 0.87 0.91 0.79 0.72 0.70 0.71 0.71 0.73 0.74 0.79 0.76 0.89 0.10 0.85 1.04 1.07 (0.16) 0.14 0.10 0.12 0.03 0.04 0.07 1.16 0.15 0.32 0.25 Alliance Bernstein US Core High Grade Fixed Inco Deutsche Bank DWS US Bond Index Fund BlackRock Core Fixed Income Universe Rank Universe Rank 5.26 Returns Gross 7.59 5.06 5.40 5.15 4.61 4.55 4.41 Returns XS Bench 1.66 (0.52) (0.64) (0.46) (0.36) (0.31) (0.35) (0.29) (0.19) (0.17) (0.14) Retums Returns Gross XS Bench 5.05 (0.88) (0.32) 5.95 (0.09) 5.51 (0.10) 4.84 (0.13) 4.75 (0.12) 4.60 (0.15) 5.27 (0.16) (0.17) 6.19 (0.14) (0.14) Returns Retums Universe Gross XS Bench Rank 10.10 4.17 42 4.76 (0.83) 5.48 (0.56) 78 5.21 (0.40) 4.70 (0.27) 4.72 (0.14) 4.69 (0.06) 5.36 (0.07) 5.76 0.00 6.39 0.06 7.16 0.31 5.14 5.59 5.57 6.16 6.22 6.05 Info Ratio Ratio Sharpe Ratio Ratio Alpha Info Ratio 1.23 (0.35) (0.51) (0.42) (0.37) Sharpe Ratio 1.87 0.76 0.69 0.55 Alpha 0.88 (0.91) (0.97) (0.70) (0.57) (0.43) (0.44) (0.40) (0.29) (0.28) (0.2%) Alpha (0.59) (0.38) (0.23) (0.21) (0.20) (0.18) (0.22) (0.23) (0.21) (0.21) (0.24) (1.70) (0.60) (0.19) (0.24) (0.32) (0.32) (0.43) (0.47) (0.51) (0.45) {0.42) 0.43 0.49 0.49 0.69 0.76 0.84 0.76 Sharpe Ratio 1.51 0.87 0.87 0.68 0.52 0.56 0.55 0.74 0.78 0.86 0.73 (0.34) (0.14) 0.10 0.27 0.39 0.42 0.45 0.38 0.42 (0.22) (0.18) (0.13) (0.08) (0.04) (0.04) 0.00 0.04 (0.42) 0.75 0.59 0.49 0.56 0.64 0.84 0.87 (0.41) (0.36) (0.24) (0.23) 0.96 0.73 (0.20) Deutsche Bank w Us on Index Fund Coreogh Quality Foed in Coved income Returns The 12-2009 Barcel Cap A Grossxs Besch Bank Srce inception