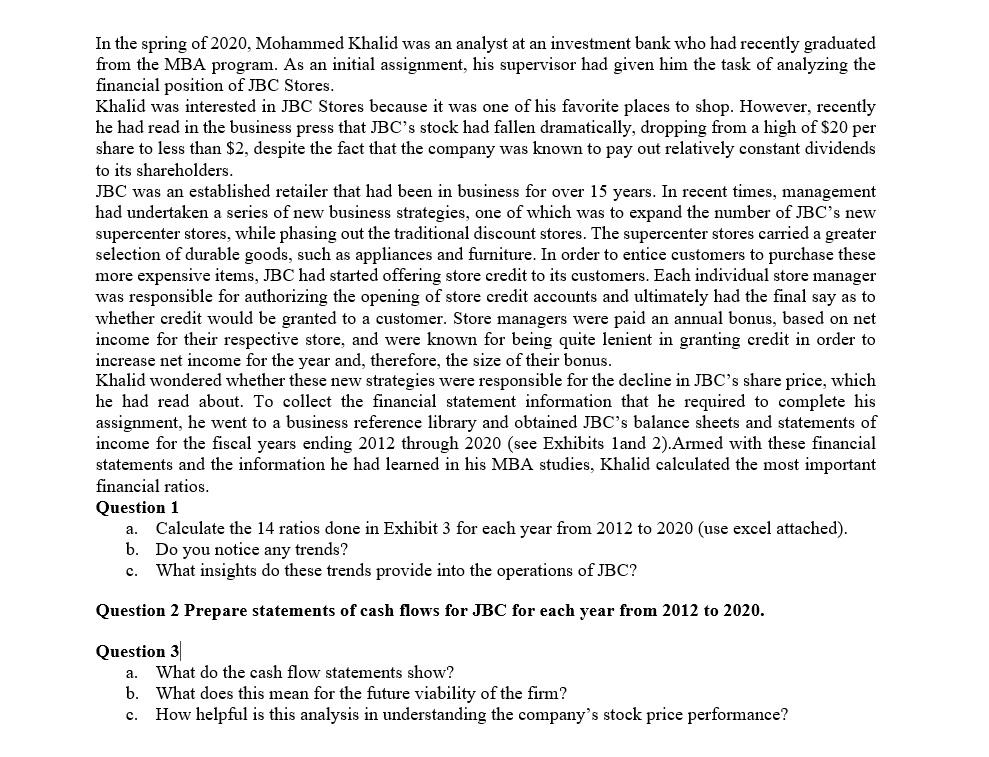
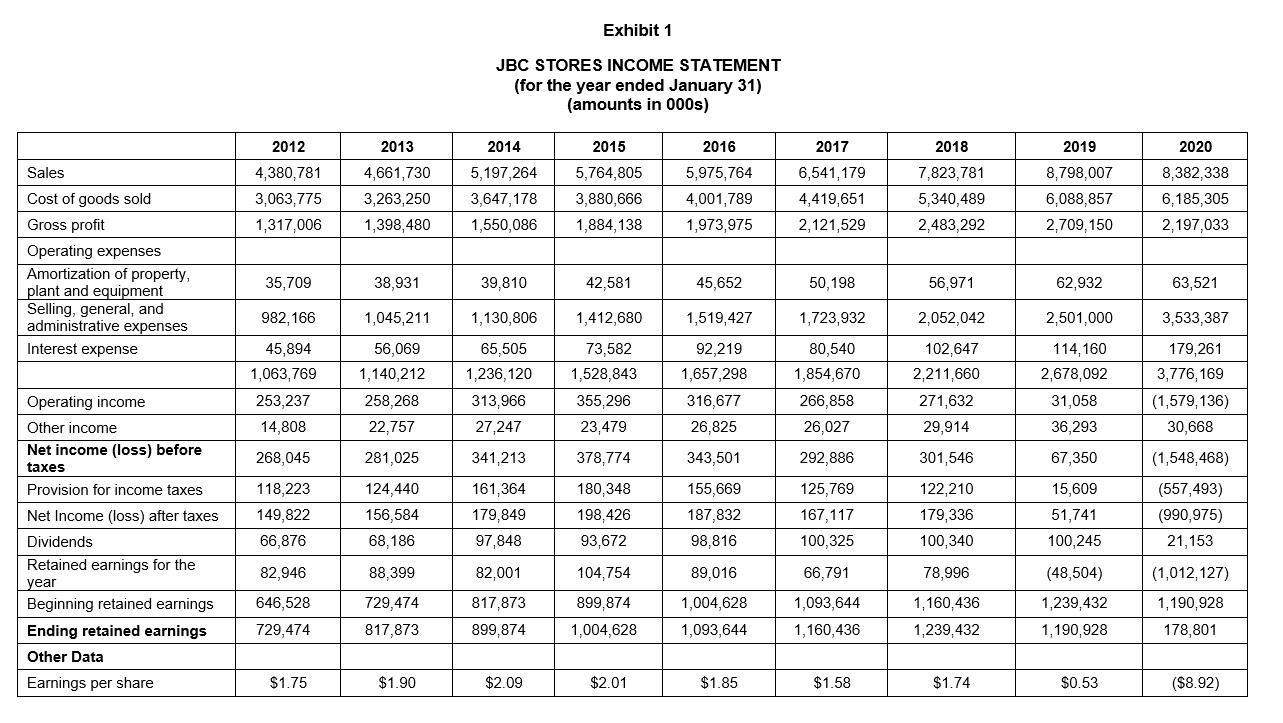
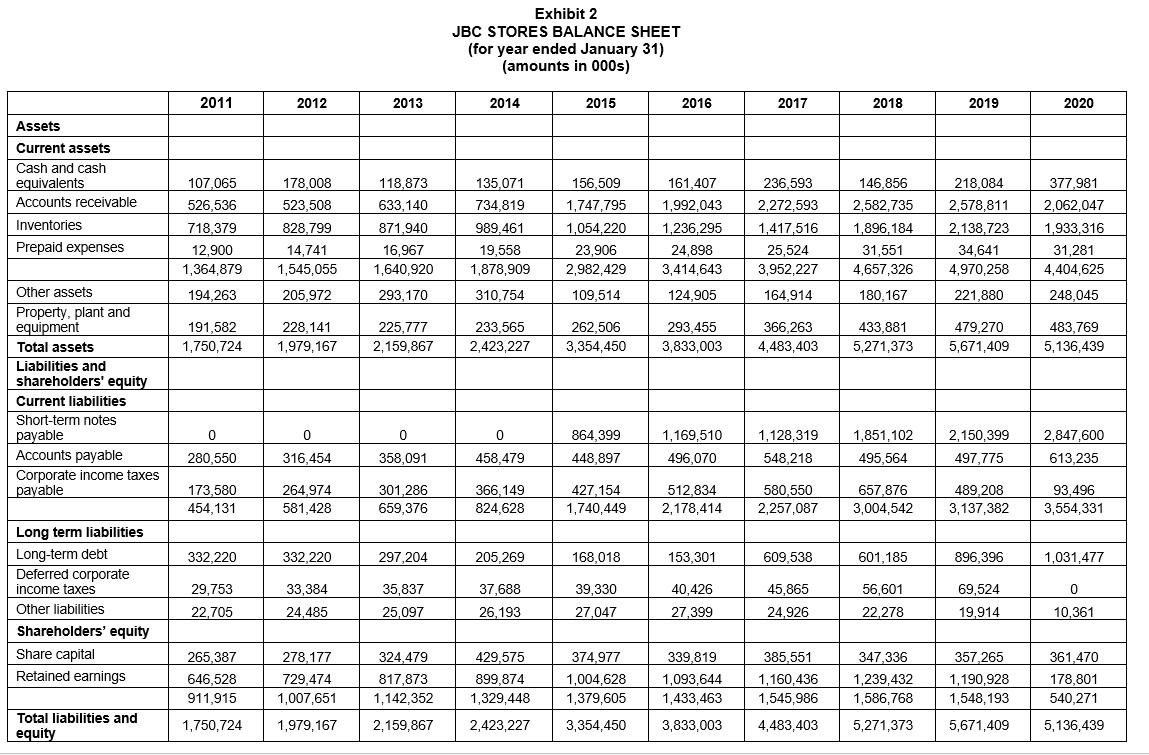
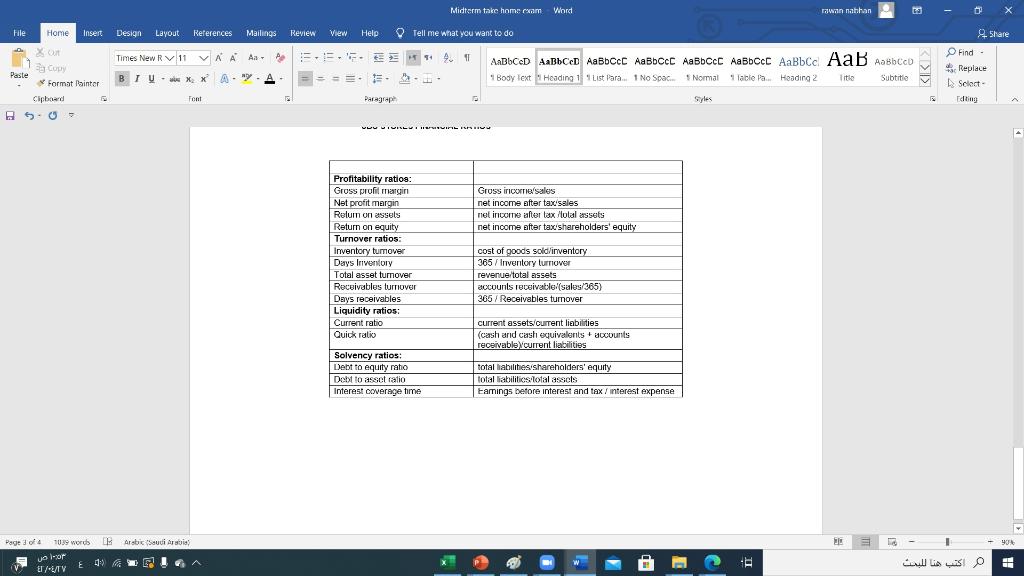
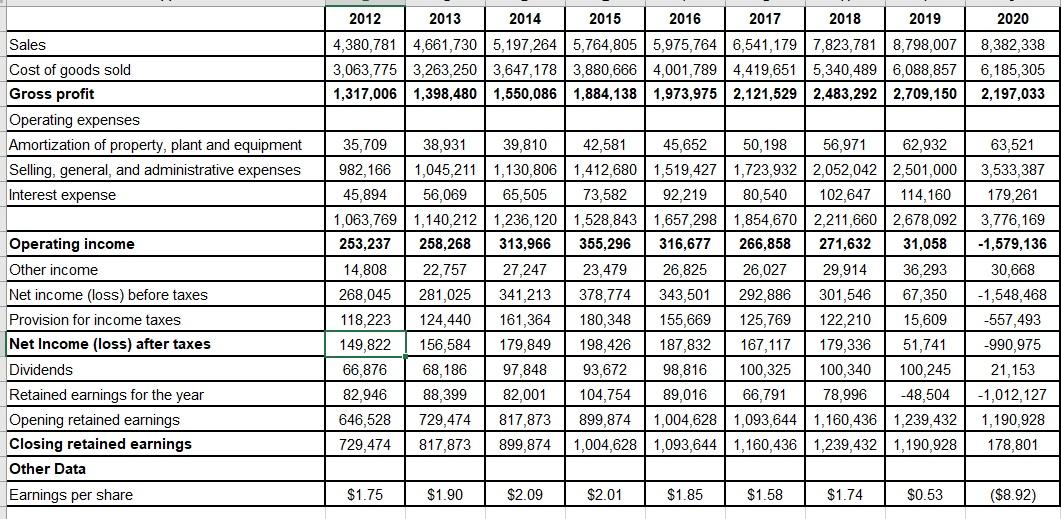
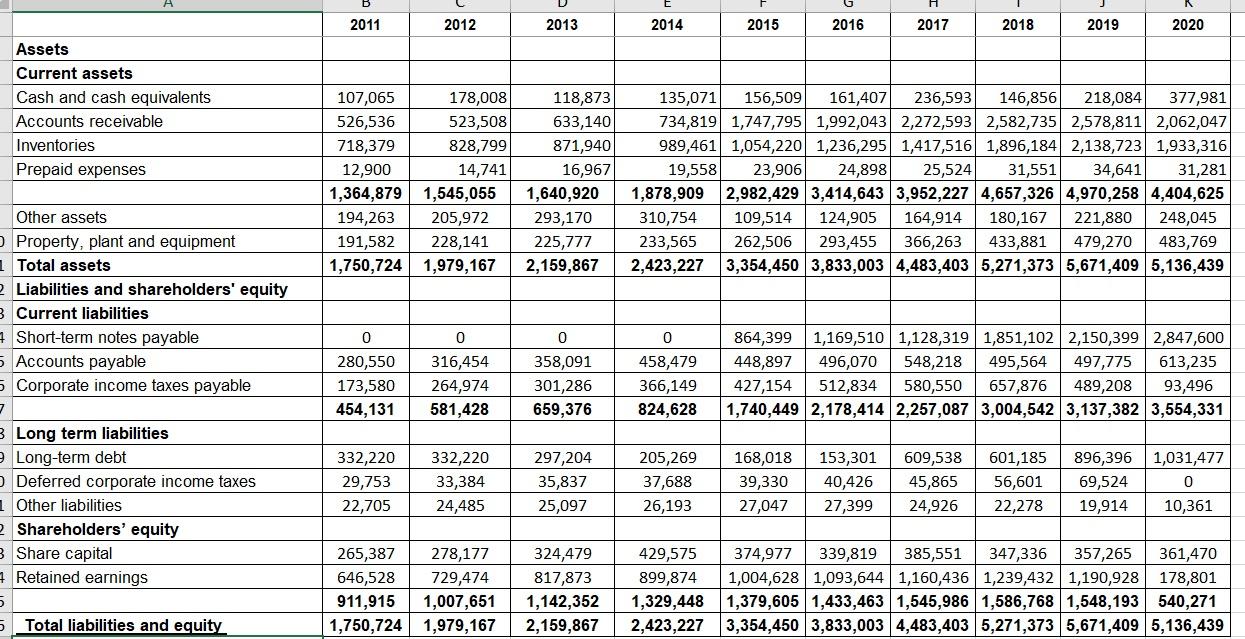
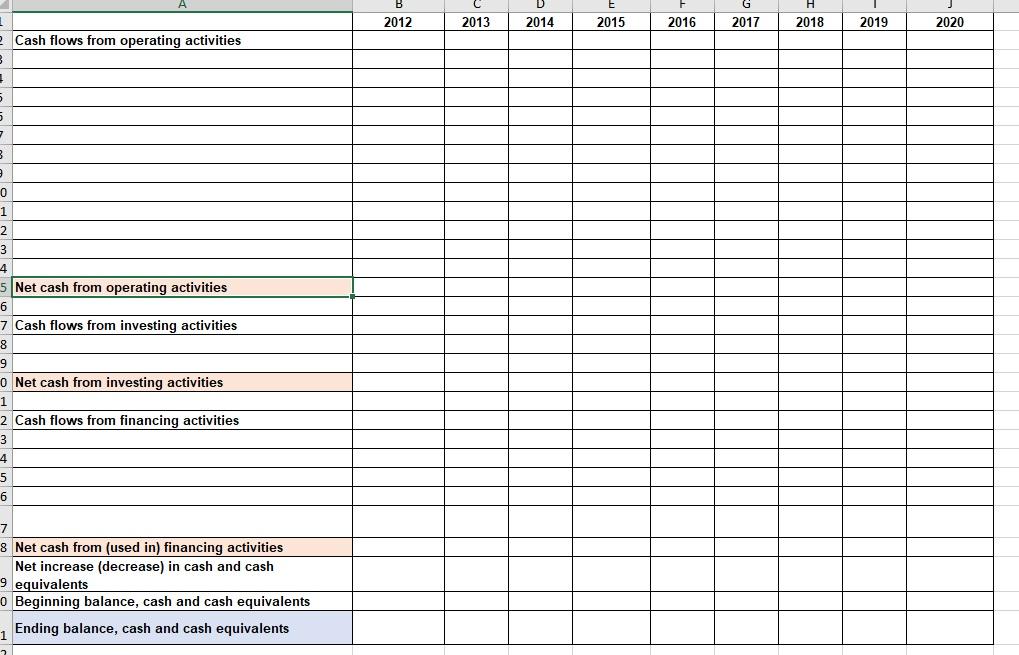
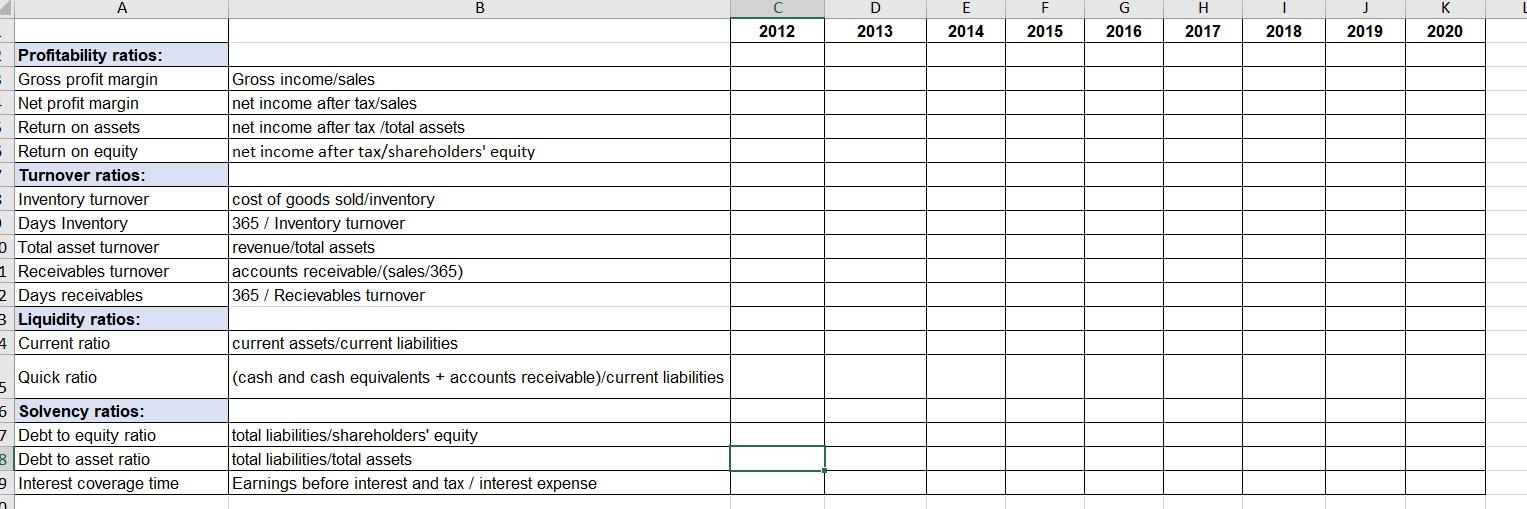
In the spring of 2020, Mohammed Khalid was an analyst at an investment bank who had recently graduated from the MBA program. As an initial assignment, his supervisor had given him the task of analyzing the financial position of JBC Stores. Khalid was interested in JBC Stores because it was one of his favorite places to shop. However, recently he had read in the business press that JBC's stock had fallen dramatically, dropping from a high of $20 per share to less than $2, despite the fact that the company was known to pay out relatively constant dividends to its shareholders. JBC was an established retailer that had been in business for over 15 years. In recent times, management had undertaken a series of new business strategies, one of which was to expand the number of JBC's new supercenter stores, while phasing out the traditional discount stores. The supercenter stores carried a greater selection of durable goods, such as appliances and furniture. In order to entice customers to purchase these more expensive items, JBC had started offering store credit to its customers. Each individual store manager was responsible for authorizing the opening of store credit accounts and ultimately had the final say as to whether credit would be granted to a customer. Store managers were paid an annual bonus, based on net income for their respective store, and were known for being quite lenient in granting credit in order to increase net income for the year and therefore, the size of their bonus. Khalid wondered whether these new strategies were responsible for the decline in JBC's share price, which he had read about. To collect the financial statement information that he required to complete his assignment, he went to a business reference library and obtained JBC's balance sheets and statements of income for the fiscal years ending 2012 through 2020 (see Exhibits land 2).Armed with these financial statements and the information he had learned in his MBA studies, Khalid calculated the most important financial ratios. Question 1 Calculate the 14 ratios done in Exhibit 3 for each year from 2012 to 2020 (use excel attached). b. Do you notice any trends? What insights do these trends provide into the operations of JBC? a. c. Question 2 Prepare statements of cash flows for JBC for each year from 2012 to 2020. a. Question 3 What do the cash flow statements show? b. What does this mean for the future viability of the firm? c. How helpful is this analysis in understanding the company's stock price performance? Exhibit 1 JBC STORES INCOME STATEMENT (for the year ended January 31) (amounts in 000s) 2012 2013 2014 2015 2016 2017 2018 2019 2020 Sales 4,380,781 3,063,775 1,317,006 4,661,730 3,263,250 1,398,480 5,197,264 3,647,178 1,550,086 5,764,805 3,880,666 1,884,138 5,975,764 4,001,789 1,973,975 6,541,179 4,419,651 2,121,529 7,823,781 5,340,489 2,483,292 8,798,007 6,088,857 2,709,150 8,382,338 6,185,305 2,197,033 Cost of goods sold Gross profit Operating expenses Amortization of property, plant and equipment Selling, general, and administrative expenses Interest expense 35,709 38,931 39,810 42,581 45,652 50,198 56,971 62,932 63,521 982,166 1,045,211 1,130,806 1,412,680 1,519,427 1,723,932 2,052,042 2,501,000 3,533,387 45,894 1,063,769 253,237 14,808 56,069 1,140,212 258,268 22,757 65,505 1,236,120 313,966 27,247 73,582 1,528,843 355,296 23,479 92,219 1,657,298 316,677 26,825 80,540 1,854,670 266,858 26,027 102,647 2,211,660 271,632 29,914 114,160 2,678,092 31,058 36,293 179,261 3,776,169 (1,579,136) 30,668 268,045 281,025 341,213 378,774 343,501 292,886 301,546 67,350 (1,548,468) Operating income Other income Net income (loss) before taxes Provision for income taxes Net Income (loss) after taxes Dividends Retained earnings for the year Beginning retained earnings Ending retained earnings Other Data Earnings per share 118,223 149,822 66,876 124,440 156,584 68,186 161,364 179,849 97,848 180,348 198,426 93,672 155,669 187,832 98,816 125,769 167,117 100,325 122,210 179,336 100,340 15,609 51,741 100,245 (557,493) (990,975) 21,153 82,946 88,399 82,001 104,754 89,016 66,791 78,996 (48,504) 729,474 899,874 646,528 729,474 817,873 899,874 1,004,628 1,093,644 1,093,644 1,160,436 1,160,436 1,239,432 1,239,432 1,190,928 (1,012,127) 1,190,928 178,801 817,873 1,004,628 $1.75 $1.90 $2.09 $2.01 $1.85 $1.58 $1.74 $0.53 ($8.92) Exhibit 2 JBC STORES BALANCE SHEET (for year ended January 31) (amounts in 000s) 2011 2012 2013 2014 2015 2016 2017 2018 2019 2020 Assets Current assets Cash and cash equivalents Accounts receivable Inventories Prepaid expenses 107,065 526,536 718,379 12,900 1,364,879 178,008 523,508 828,799 14.741 1,545,055 118,873 633, 140 871,940 16,967 1,640,920 135,071 734,819 989,461 19,558 1,878,909 156,509 1,747,795 1,054.220 23,906 2,982,429 161,407 1,992,043 1,236,295 24.898 3,414,643 236,593 2,272,593 1,417,516 25,524 3,952,227 164,914 146,856 2,582,735 1,896,184 31,551 4,657,326 218,084 2,578,811 2,138,723 34,641 4,970,258 377,981 2,062,047 1,933,316 31,281 4,404,625 194,263 205,972 293,170 310.754 109,514 124,905 180, 167 221,880 248,045 191,582 1,750,724 228,141 1,979,167 225,777 2,159,867 233,565 2,423,227 262,506 3,354,450 293,455 3,833,003 366,263 4,483,403 433,881 5,271,373 479,270 5,671,409 483,769 5,136,439 Other assets Property, plant and equipment Total assets Liabilities and shareholders' equity Current liabilities Short-term notes payable Accounts payable Corporate income taxes payable 0 0 0 0 358,091 864,399 448,897 1,169,510 496,070 1,128,319 548,218 1,851,102 495,564 2,150,399 497,775 2,847,600 613,235 280.550 316,454 458,479 173,580 454,131 264,974 581,428 301,286 659,376 366,149 824,628 427,154 1,740,449 512,834 2,178,414 580,550 2,257,087 657,876 3,004,542 489,208 3,137,382 93,496 3,554,331 332,220 332,220 297,204 205,269 168,018 153,301 609,538 601,185 896,396 1,031,477 40,426 69,524 Long term liabilities Long-term debt Deferred corporate income taxes Other liabilities Shareholders' equity Share capital Retained earnings 29,753 22,705 33,384 24,485 35,837 25,097 37,688 26,193 39,330 27,047 45,865 24,926 56,601 22278 0 10,361 27,399 19,914 265,387 646,528 911,915 278,177 729,474 1,007,651 324,479 817,873 1,142,352 429,575 899,874 1,329,448 374,977 1,004,628 1,379,605 339,819 1,093,644 1,433,463 385,551 1,160,436 1,545,986 347,336 1,239,432 1,586,768 5,271,373 357,265 1,190,928 1,548,193 361,470 178,801 540,271 Total liabilities and equity 1,750,724 1,979,167 2,159,867 2,423,227 3,354,450 3,833,003 4,483,403 5,671,409 5,136,439 Midterm take home exam Wordt wan nabhan ES Hle Home Insert Design Layout References Mailings Review View Help Tell me what you want to do Times New R 11 VA A A A . Cuby Format Painter 2. Share Find - #Replace Select- Editing Peste BIU.ww XX A. y. A "Body Text Heading List Para.. 1 No Space Normal Normal 'lable Pa Heading 2 Title Subtitle Tont Paragraph Syles F VUUGILIINILISHI Gross incre'salas net income after taxt sales nel income after lax /lolal assets net income after tax shareholders' equity Profitability ratios: Gross profit margin Net profit margin Relumn on assets Return on equity Turnover ratios: Inventory tumover Days Inventory Total asset turnover Receivables turnover Days receivables Liquidity ratios Current ratio Quick ralio cost of goods sold inventory 365 / Inventory turnover revenue/total assets accounts receivable(salus/365) 365 / Receivables turnover current assets/current liabilities (cash and cash equivalents + accounts receivable current liabilities Solvency ratios: Debt to equity raho Detyt to asset ratio Interest coverage time total abilities shareholders' equity total liabilities total asics Eamings before interest and tax / interest expense Page of 41039 words B Arabic Saudi Arabia E 1 YUN 5 voor E El//TV 2020 Sales 2012 2013 2014 2015 2016 2017 2018 2019 4,380,781 4,661,730 5,197,264 5,764,8055,975,7646,541,1797,823,781 | 8,798,007 3,063,775 3,263,250 3,647,178 3,880,666 4,001,789 4,419,6515,340,489 6,088,857 1,317,006 1,398,480 1,550,0861,884,138 1,973,975 2,121,529 2,483,292 2,709,150 8,382,338 6,185,305 2,197,033 Cost of goods sold Gross profit Operating expenses Amortization of property, plant and equipment Selling, general, and administrative expenses Interest expense Operating income Other income Net income (loss) before taxes Provision for income taxes Net Income (loss) after taxes Dividends Retained earnings for the year Opening retained earnings Closing retained earnings Other Data Earnings per share 35,709 38,931 39,810 42,581 45,652 50,198 56,971 62,932 982,166 1,045,211 1,130,806 1,412,680 1,519,4271,723,9322,052,0422,501,000 45,894 56,069 65,505 73,582 92,219 80,540 102,647 114,160 1,063,769 1,140,212 | 1,236,120 1,528,843 1,657,298 1,854,670 2,211,6602,678,092 253,237 258,268 313,966 355,296 316,677 266,858 271,632 31,058 14,808 22,757 27,247 23,479 26,825 26,027 29,914 36,293 268,045 281,025 341,213 378,774 343,501 292,886 301,546 67,350 118,223 124,440 161,364 180,348 155,669 125,769 122,210 15,609 149,822 156,584 179,849 198,426 187,832 167,117 179,336 51,741 66,876 68,186 97,848 93,672 98,816 100,325 100,340 100,245 82,946 88,399 82,001 104,754 89,016 66,791 78,996 -48,504 646,528 729,474 817,873 899,874 1,004,628 1,093,644 1,160,436 1,239,432 729,474 817,873 899,874 1,004,628 1,093,644 1,160,436 1,239,432 1,190,928 63,521 3,533,387 179,261 3,776,169 -1,579,136 30,668 -1,548,468 -557,493 -990,975 21,153 -1,012,127 1,190,928 178,801 $1.75 $1.90 $2.09 $2.01 $1.85 $1.58 $1.74 $0.53 ($8.92) 2011 2012 2013 2014 2015 2016 2017 2018 2019 2020 Assets Current assets Cash and cash equivalents Accounts receivable Inventories Prepaid expenses 107,065 178,008 526,536 523,508 718,379 828,799 12,900 14,741 1,364,879 1,545,055 194,263 205,972 191,582 228,141 1,750,724 1,979,167 118,873 633,140 871,940 16,967 1,640,920 293,170 225,777 2,159,867 135,071 156,509 161,407 236,593 146,856 218,084 377,981 734,819 1,747,795 1,992,043 2,272,593 2,582,735 2,578,811 2,062,047 989,461 1,054,220 1,236,295 1,417,516 1,896,184 2,138,723 1,933,316 19,558 23,906 24,898 25,524 31,551 34,641 31,281 1,878,909 2,982,429 3,414,643 3,952,227 4,657,326 4,970,258 4,404,625 310,754 109,514 124,905 164,914 180,167 221,880 248,045 233,565 262,506 293,455 366,263 433,881 479,270 483,769 2,423,227 3,354,450 3,833,003 4,483,403 5,271,373 5,671,409 5,136,439 Other assets Property, plant and equipment 1 Total assets 2 Liabilities and shareholders' equity Current liabilities Short-term notes payable 5 Accounts payable 5 Corporate income taxes payable 0 0 0 280,550 173,580 454,131 0 316,454 264,974 581,428 358,091 301,286 659,376 458,479 366,149 824,628 864,399 1,169,5101,128,319 1,851,102 2,150,399 2,847,600 448,897 496,070 548,218 495,564 497,775 613,235 427,154 512,834 580,550 657,876 489,208 93,496 1,740,449 2,178,414 2,257,087 3,004,542 3,137,382 3,554,331 3 Long term liabilities Long-term debt Deferred corporate income taxes Other liabilities Shareholders' equity 3 Share capital 1 Retained earnings 332,220 29,753 22,705 332,220 33,384 24,485 297,204 35,837 25,097 205,269 37,688 26,193 168,018 39,330 27,047 153,301 40,426 27,399 609,538 45,865 24,926 601,185 56,601 22,278 896,396 69,524 19,914 1,031,477 0 10,361 265,387 278,177 646,528 729,474 911,915 1,007,651 1,750,724 1,979,167 324,479 817,873 1,142,352 2,159,867 429,575 374,977 339,819 385,551 347,336 357,265 361,470 899,874 1,004,628 1,093,644 1,160,436 1,239,432 1,190,928 178,801 1,329,448 1,379,605 1,433,463 1,545,986 1,586,768 1,548,193 540,271 2,423,227 3,354,450 3,833,003 4,483,403 5,271,373 5,671,409 5,136,439 5 Total liabilities and equity 2012 2013 2014 2015 2016 2017 2018 2019 2020 Cash flows from operating activities . 5 5 7 3 3 0 1 2 3 4 5 Net cash from operating activities 6 7 Cash flows from investing activities 8 9 0 Net cash from investing activities 1 2 Cash flows from financing activities 3 4 5 6 7 8 Net cash from (used in) financing activities Net increase (decrease) in cash and cash 9 equivalents o Beginning balance, cash and cash equivalents 1 Ending balance, cash and cash equivalents A B C 2012 D 2013 E 2014 G 2016 H 2017 J 2019 K 2020 2015 2018 Gross income/sales net income after tax/sales net income after tax /total assets net income after tax/shareholders' equity Profitability ratios: Gross profit margin Net profit margin Return on assets Return on equity Turnover ratios: Inventory turnover Days Inventory 0 Total asset turnover 1 Receivables turnover 2 Days receivables 3 Liquidity ratios: 4 Current ratio cost of goods sold/inventory 365 / Inventory turnover revenue/total assets accounts receivable/(sales/365) 365 / Recievables turnover current assets/current liabilities (cash and cash equivalents + accounts receivable)/current liabilities Quick ratio 5 6 Solvency ratios: 7 Debt to equity ratio B Debt to asset ratio 9 Interest coverage time total liabilities/shareholders' equity total liabilities/total assets Earnings before interest and tax / interest expense In the spring of 2020, Mohammed Khalid was an analyst at an investment bank who had recently graduated from the MBA program. As an initial assignment, his supervisor had given him the task of analyzing the financial position of JBC Stores. Khalid was interested in JBC Stores because it was one of his favorite places to shop. However, recently he had read in the business press that JBC's stock had fallen dramatically, dropping from a high of $20 per share to less than $2, despite the fact that the company was known to pay out relatively constant dividends to its shareholders. JBC was an established retailer that had been in business for over 15 years. In recent times, management had undertaken a series of new business strategies, one of which was to expand the number of JBC's new supercenter stores, while phasing out the traditional discount stores. The supercenter stores carried a greater selection of durable goods, such as appliances and furniture. In order to entice customers to purchase these more expensive items, JBC had started offering store credit to its customers. Each individual store manager was responsible for authorizing the opening of store credit accounts and ultimately had the final say as to whether credit would be granted to a customer. Store managers were paid an annual bonus, based on net income for their respective store, and were known for being quite lenient in granting credit in order to increase net income for the year and therefore, the size of their bonus. Khalid wondered whether these new strategies were responsible for the decline in JBC's share price, which he had read about. To collect the financial statement information that he required to complete his assignment, he went to a business reference library and obtained JBC's balance sheets and statements of income for the fiscal years ending 2012 through 2020 (see Exhibits land 2).Armed with these financial statements and the information he had learned in his MBA studies, Khalid calculated the most important financial ratios. Question 1 Calculate the 14 ratios done in Exhibit 3 for each year from 2012 to 2020 (use excel attached). b. Do you notice any trends? What insights do these trends provide into the operations of JBC? a. c. Question 2 Prepare statements of cash flows for JBC for each year from 2012 to 2020. a. Question 3 What do the cash flow statements show? b. What does this mean for the future viability of the firm? c. How helpful is this analysis in understanding the company's stock price performance? Exhibit 1 JBC STORES INCOME STATEMENT (for the year ended January 31) (amounts in 000s) 2012 2013 2014 2015 2016 2017 2018 2019 2020 Sales 4,380,781 3,063,775 1,317,006 4,661,730 3,263,250 1,398,480 5,197,264 3,647,178 1,550,086 5,764,805 3,880,666 1,884,138 5,975,764 4,001,789 1,973,975 6,541,179 4,419,651 2,121,529 7,823,781 5,340,489 2,483,292 8,798,007 6,088,857 2,709,150 8,382,338 6,185,305 2,197,033 Cost of goods sold Gross profit Operating expenses Amortization of property, plant and equipment Selling, general, and administrative expenses Interest expense 35,709 38,931 39,810 42,581 45,652 50,198 56,971 62,932 63,521 982,166 1,045,211 1,130,806 1,412,680 1,519,427 1,723,932 2,052,042 2,501,000 3,533,387 45,894 1,063,769 253,237 14,808 56,069 1,140,212 258,268 22,757 65,505 1,236,120 313,966 27,247 73,582 1,528,843 355,296 23,479 92,219 1,657,298 316,677 26,825 80,540 1,854,670 266,858 26,027 102,647 2,211,660 271,632 29,914 114,160 2,678,092 31,058 36,293 179,261 3,776,169 (1,579,136) 30,668 268,045 281,025 341,213 378,774 343,501 292,886 301,546 67,350 (1,548,468) Operating income Other income Net income (loss) before taxes Provision for income taxes Net Income (loss) after taxes Dividends Retained earnings for the year Beginning retained earnings Ending retained earnings Other Data Earnings per share 118,223 149,822 66,876 124,440 156,584 68,186 161,364 179,849 97,848 180,348 198,426 93,672 155,669 187,832 98,816 125,769 167,117 100,325 122,210 179,336 100,340 15,609 51,741 100,245 (557,493) (990,975) 21,153 82,946 88,399 82,001 104,754 89,016 66,791 78,996 (48,504) 729,474 899,874 646,528 729,474 817,873 899,874 1,004,628 1,093,644 1,093,644 1,160,436 1,160,436 1,239,432 1,239,432 1,190,928 (1,012,127) 1,190,928 178,801 817,873 1,004,628 $1.75 $1.90 $2.09 $2.01 $1.85 $1.58 $1.74 $0.53 ($8.92) Exhibit 2 JBC STORES BALANCE SHEET (for year ended January 31) (amounts in 000s) 2011 2012 2013 2014 2015 2016 2017 2018 2019 2020 Assets Current assets Cash and cash equivalents Accounts receivable Inventories Prepaid expenses 107,065 526,536 718,379 12,900 1,364,879 178,008 523,508 828,799 14.741 1,545,055 118,873 633, 140 871,940 16,967 1,640,920 135,071 734,819 989,461 19,558 1,878,909 156,509 1,747,795 1,054.220 23,906 2,982,429 161,407 1,992,043 1,236,295 24.898 3,414,643 236,593 2,272,593 1,417,516 25,524 3,952,227 164,914 146,856 2,582,735 1,896,184 31,551 4,657,326 218,084 2,578,811 2,138,723 34,641 4,970,258 377,981 2,062,047 1,933,316 31,281 4,404,625 194,263 205,972 293,170 310.754 109,514 124,905 180, 167 221,880 248,045 191,582 1,750,724 228,141 1,979,167 225,777 2,159,867 233,565 2,423,227 262,506 3,354,450 293,455 3,833,003 366,263 4,483,403 433,881 5,271,373 479,270 5,671,409 483,769 5,136,439 Other assets Property, plant and equipment Total assets Liabilities and shareholders' equity Current liabilities Short-term notes payable Accounts payable Corporate income taxes payable 0 0 0 0 358,091 864,399 448,897 1,169,510 496,070 1,128,319 548,218 1,851,102 495,564 2,150,399 497,775 2,847,600 613,235 280.550 316,454 458,479 173,580 454,131 264,974 581,428 301,286 659,376 366,149 824,628 427,154 1,740,449 512,834 2,178,414 580,550 2,257,087 657,876 3,004,542 489,208 3,137,382 93,496 3,554,331 332,220 332,220 297,204 205,269 168,018 153,301 609,538 601,185 896,396 1,031,477 40,426 69,524 Long term liabilities Long-term debt Deferred corporate income taxes Other liabilities Shareholders' equity Share capital Retained earnings 29,753 22,705 33,384 24,485 35,837 25,097 37,688 26,193 39,330 27,047 45,865 24,926 56,601 22278 0 10,361 27,399 19,914 265,387 646,528 911,915 278,177 729,474 1,007,651 324,479 817,873 1,142,352 429,575 899,874 1,329,448 374,977 1,004,628 1,379,605 339,819 1,093,644 1,433,463 385,551 1,160,436 1,545,986 347,336 1,239,432 1,586,768 5,271,373 357,265 1,190,928 1,548,193 361,470 178,801 540,271 Total liabilities and equity 1,750,724 1,979,167 2,159,867 2,423,227 3,354,450 3,833,003 4,483,403 5,671,409 5,136,439 Midterm take home exam Wordt wan nabhan ES Hle Home Insert Design Layout References Mailings Review View Help Tell me what you want to do Times New R 11 VA A A A . Cuby Format Painter 2. Share Find - #Replace Select- Editing Peste BIU.ww XX A. y. A "Body Text Heading List Para.. 1 No Space Normal Normal 'lable Pa Heading 2 Title Subtitle Tont Paragraph Syles F VUUGILIINILISHI Gross incre'salas net income after taxt sales nel income after lax /lolal assets net income after tax shareholders' equity Profitability ratios: Gross profit margin Net profit margin Relumn on assets Return on equity Turnover ratios: Inventory tumover Days Inventory Total asset turnover Receivables turnover Days receivables Liquidity ratios Current ratio Quick ralio cost of goods sold inventory 365 / Inventory turnover revenue/total assets accounts receivable(salus/365) 365 / Receivables turnover current assets/current liabilities (cash and cash equivalents + accounts receivable current liabilities Solvency ratios: Debt to equity raho Detyt to asset ratio Interest coverage time total abilities shareholders' equity total liabilities total asics Eamings before interest and tax / interest expense Page of 41039 words B Arabic Saudi Arabia E 1 YUN 5 voor E El//TV 2020 Sales 2012 2013 2014 2015 2016 2017 2018 2019 4,380,781 4,661,730 5,197,264 5,764,8055,975,7646,541,1797,823,781 | 8,798,007 3,063,775 3,263,250 3,647,178 3,880,666 4,001,789 4,419,6515,340,489 6,088,857 1,317,006 1,398,480 1,550,0861,884,138 1,973,975 2,121,529 2,483,292 2,709,150 8,382,338 6,185,305 2,197,033 Cost of goods sold Gross profit Operating expenses Amortization of property, plant and equipment Selling, general, and administrative expenses Interest expense Operating income Other income Net income (loss) before taxes Provision for income taxes Net Income (loss) after taxes Dividends Retained earnings for the year Opening retained earnings Closing retained earnings Other Data Earnings per share 35,709 38,931 39,810 42,581 45,652 50,198 56,971 62,932 982,166 1,045,211 1,130,806 1,412,680 1,519,4271,723,9322,052,0422,501,000 45,894 56,069 65,505 73,582 92,219 80,540 102,647 114,160 1,063,769 1,140,212 | 1,236,120 1,528,843 1,657,298 1,854,670 2,211,6602,678,092 253,237 258,268 313,966 355,296 316,677 266,858 271,632 31,058 14,808 22,757 27,247 23,479 26,825 26,027 29,914 36,293 268,045 281,025 341,213 378,774 343,501 292,886 301,546 67,350 118,223 124,440 161,364 180,348 155,669 125,769 122,210 15,609 149,822 156,584 179,849 198,426 187,832 167,117 179,336 51,741 66,876 68,186 97,848 93,672 98,816 100,325 100,340 100,245 82,946 88,399 82,001 104,754 89,016 66,791 78,996 -48,504 646,528 729,474 817,873 899,874 1,004,628 1,093,644 1,160,436 1,239,432 729,474 817,873 899,874 1,004,628 1,093,644 1,160,436 1,239,432 1,190,928 63,521 3,533,387 179,261 3,776,169 -1,579,136 30,668 -1,548,468 -557,493 -990,975 21,153 -1,012,127 1,190,928 178,801 $1.75 $1.90 $2.09 $2.01 $1.85 $1.58 $1.74 $0.53 ($8.92) 2011 2012 2013 2014 2015 2016 2017 2018 2019 2020 Assets Current assets Cash and cash equivalents Accounts receivable Inventories Prepaid expenses 107,065 178,008 526,536 523,508 718,379 828,799 12,900 14,741 1,364,879 1,545,055 194,263 205,972 191,582 228,141 1,750,724 1,979,167 118,873 633,140 871,940 16,967 1,640,920 293,170 225,777 2,159,867 135,071 156,509 161,407 236,593 146,856 218,084 377,981 734,819 1,747,795 1,992,043 2,272,593 2,582,735 2,578,811 2,062,047 989,461 1,054,220 1,236,295 1,417,516 1,896,184 2,138,723 1,933,316 19,558 23,906 24,898 25,524 31,551 34,641 31,281 1,878,909 2,982,429 3,414,643 3,952,227 4,657,326 4,970,258 4,404,625 310,754 109,514 124,905 164,914 180,167 221,880 248,045 233,565 262,506 293,455 366,263 433,881 479,270 483,769 2,423,227 3,354,450 3,833,003 4,483,403 5,271,373 5,671,409 5,136,439 Other assets Property, plant and equipment 1 Total assets 2 Liabilities and shareholders' equity Current liabilities Short-term notes payable 5 Accounts payable 5 Corporate income taxes payable 0 0 0 280,550 173,580 454,131 0 316,454 264,974 581,428 358,091 301,286 659,376 458,479 366,149 824,628 864,399 1,169,5101,128,319 1,851,102 2,150,399 2,847,600 448,897 496,070 548,218 495,564 497,775 613,235 427,154 512,834 580,550 657,876 489,208 93,496 1,740,449 2,178,414 2,257,087 3,004,542 3,137,382 3,554,331 3 Long term liabilities Long-term debt Deferred corporate income taxes Other liabilities Shareholders' equity 3 Share capital 1 Retained earnings 332,220 29,753 22,705 332,220 33,384 24,485 297,204 35,837 25,097 205,269 37,688 26,193 168,018 39,330 27,047 153,301 40,426 27,399 609,538 45,865 24,926 601,185 56,601 22,278 896,396 69,524 19,914 1,031,477 0 10,361 265,387 278,177 646,528 729,474 911,915 1,007,651 1,750,724 1,979,167 324,479 817,873 1,142,352 2,159,867 429,575 374,977 339,819 385,551 347,336 357,265 361,470 899,874 1,004,628 1,093,644 1,160,436 1,239,432 1,190,928 178,801 1,329,448 1,379,605 1,433,463 1,545,986 1,586,768 1,548,193 540,271 2,423,227 3,354,450 3,833,003 4,483,403 5,271,373 5,671,409 5,136,439 5 Total liabilities and equity 2012 2013 2014 2015 2016 2017 2018 2019 2020 Cash flows from operating activities . 5 5 7 3 3 0 1 2 3 4 5 Net cash from operating activities 6 7 Cash flows from investing activities 8 9 0 Net cash from investing activities 1 2 Cash flows from financing activities 3 4 5 6 7 8 Net cash from (used in) financing activities Net increase (decrease) in cash and cash 9 equivalents o Beginning balance, cash and cash equivalents 1 Ending balance, cash and cash equivalents A B C 2012 D 2013 E 2014 G 2016 H 2017 J 2019 K 2020 2015 2018 Gross income/sales net income after tax/sales net income after tax /total assets net income after tax/shareholders' equity Profitability ratios: Gross profit margin Net profit margin Return on assets Return on equity Turnover ratios: Inventory turnover Days Inventory 0 Total asset turnover 1 Receivables turnover 2 Days receivables 3 Liquidity ratios: 4 Current ratio cost of goods sold/inventory 365 / Inventory turnover revenue/total assets accounts receivable/(sales/365) 365 / Recievables turnover current assets/current liabilities (cash and cash equivalents + accounts receivable)/current liabilities Quick ratio 5 6 Solvency ratios: 7 Debt to equity ratio B Debt to asset ratio 9 Interest coverage time total liabilities/shareholders' equity total liabilities/total assets Earnings before interest and tax / interest expense